


Home Oil Reserves
Home Oil Reserves

Proved oil reserves · end of 2025
Poured out as one drop, Venezuela’s oil would be 5.9 km wide and 2.4 km tall, three times the height of Burj Khalifa. Every drop here holds its country’s true volume.
Drops at true volume: OPEC ASB 2026; Canada: NRCan. City and tower: © OpenStreetMap contributors. Ground: Copernicus DEM, Sentinel-2 cloudless 2016 by EOX.
Drops of crude
A billion barrels fill 0.159 km³; each drop is a flattened sphere, 0.4 times as tall as it is wide, holding exactly the country’s reserves. Pick countries to line them up at one scale with Burj Khalifa.
Where the oil is
Each circle’s area is a country’s proved reserves. Tap a circle to see its numbers.
The land over the oil
Each country is modelled to its real border and relief, with its reserves spilled 1 m deep as a black pool of true area that runs from its best-known field into the lowest ground nearby. Tap a country to see it large and follow it through the page.
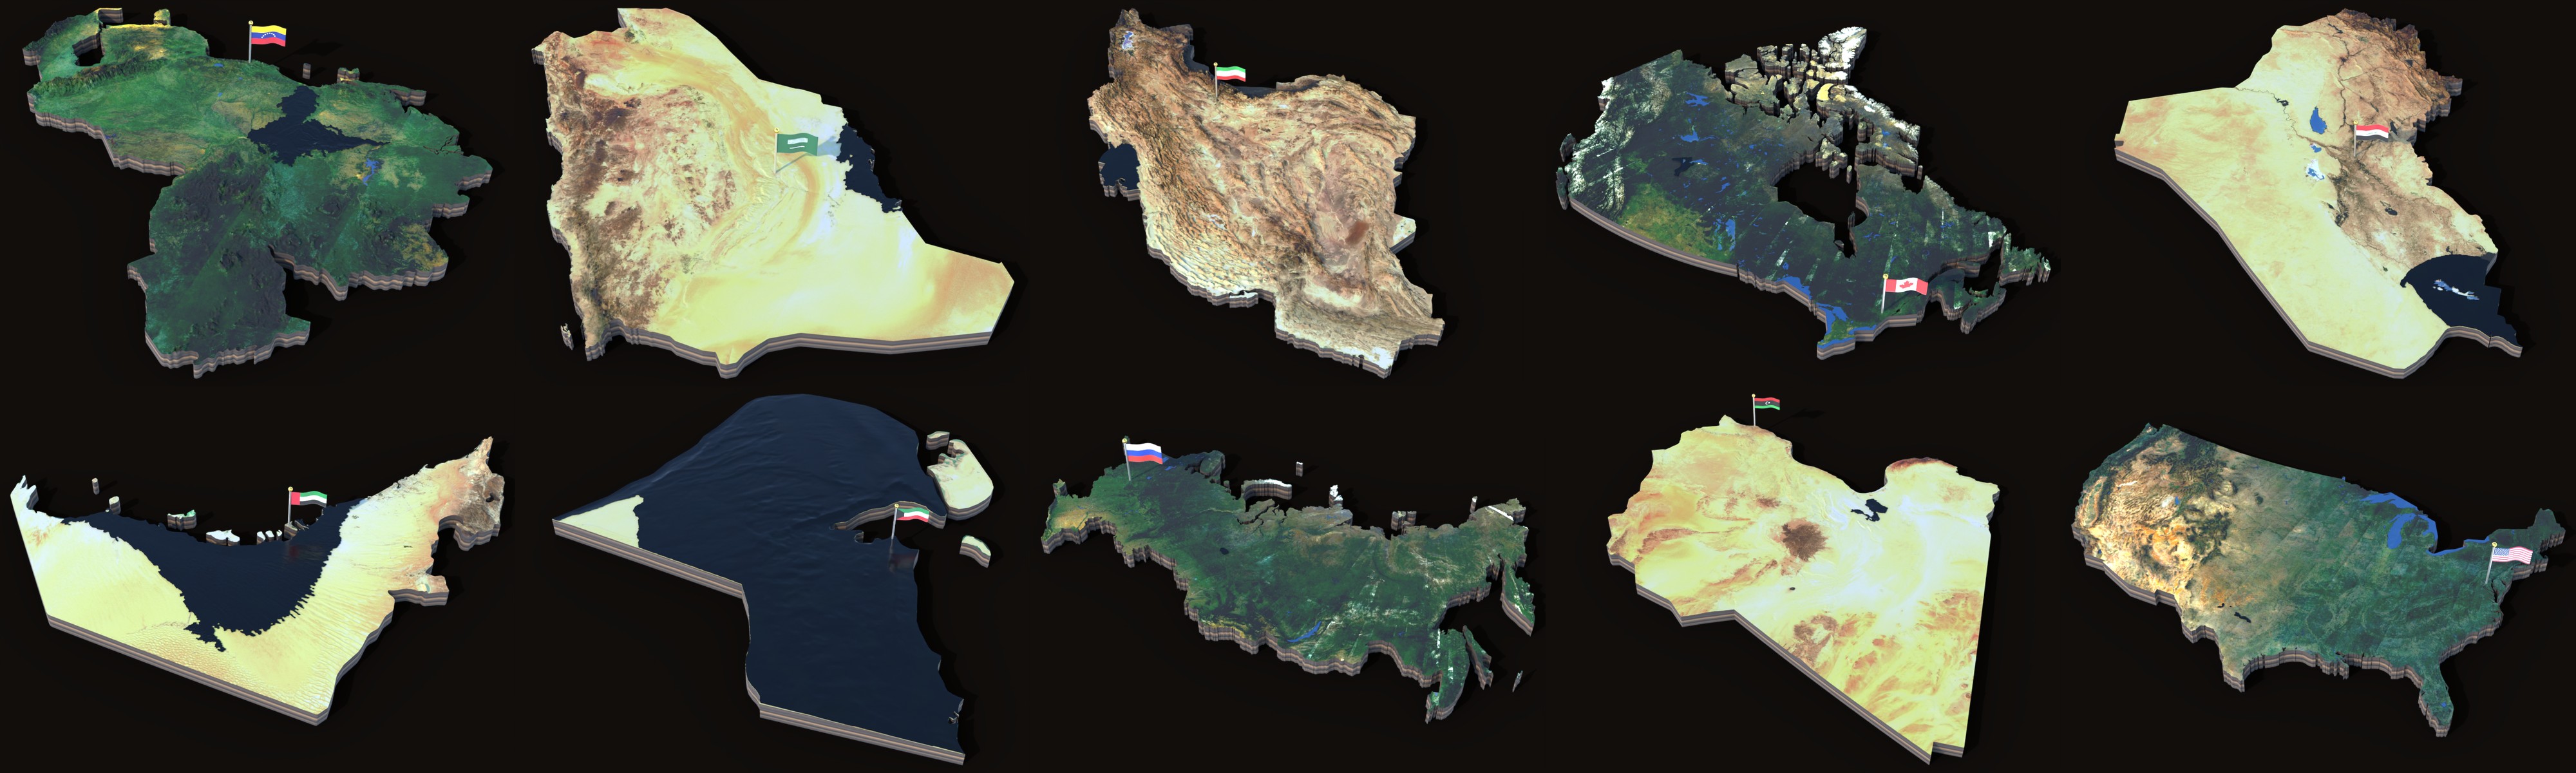 the oil
Borders: Natural Earth. Relief: ETOPO 2022 15″ (vertical exaggeration per model). Colour: Sentinel-2 cloudless 2016. The pool’s area is exact; its shape is a model (grown from the main field into the lowest ground nearby). United States: contiguous 48 states only (Alaska’s North Slope not shown). Small islets under about 4 pixels are left out. Flags fly over each capital (Washington’s pole stands 6 km inland of the simplified coast).
Years left at today’s output
Reserves divided by 2025 production: how long each country could keep pumping at today’s rate with no new discoveries. A yardstick, not a forecast.
Reserves since 1980
The twelve largest reserves each year from 1980 to 2025. Most of the big jumps are new accounting, not new oil fields.
The poster
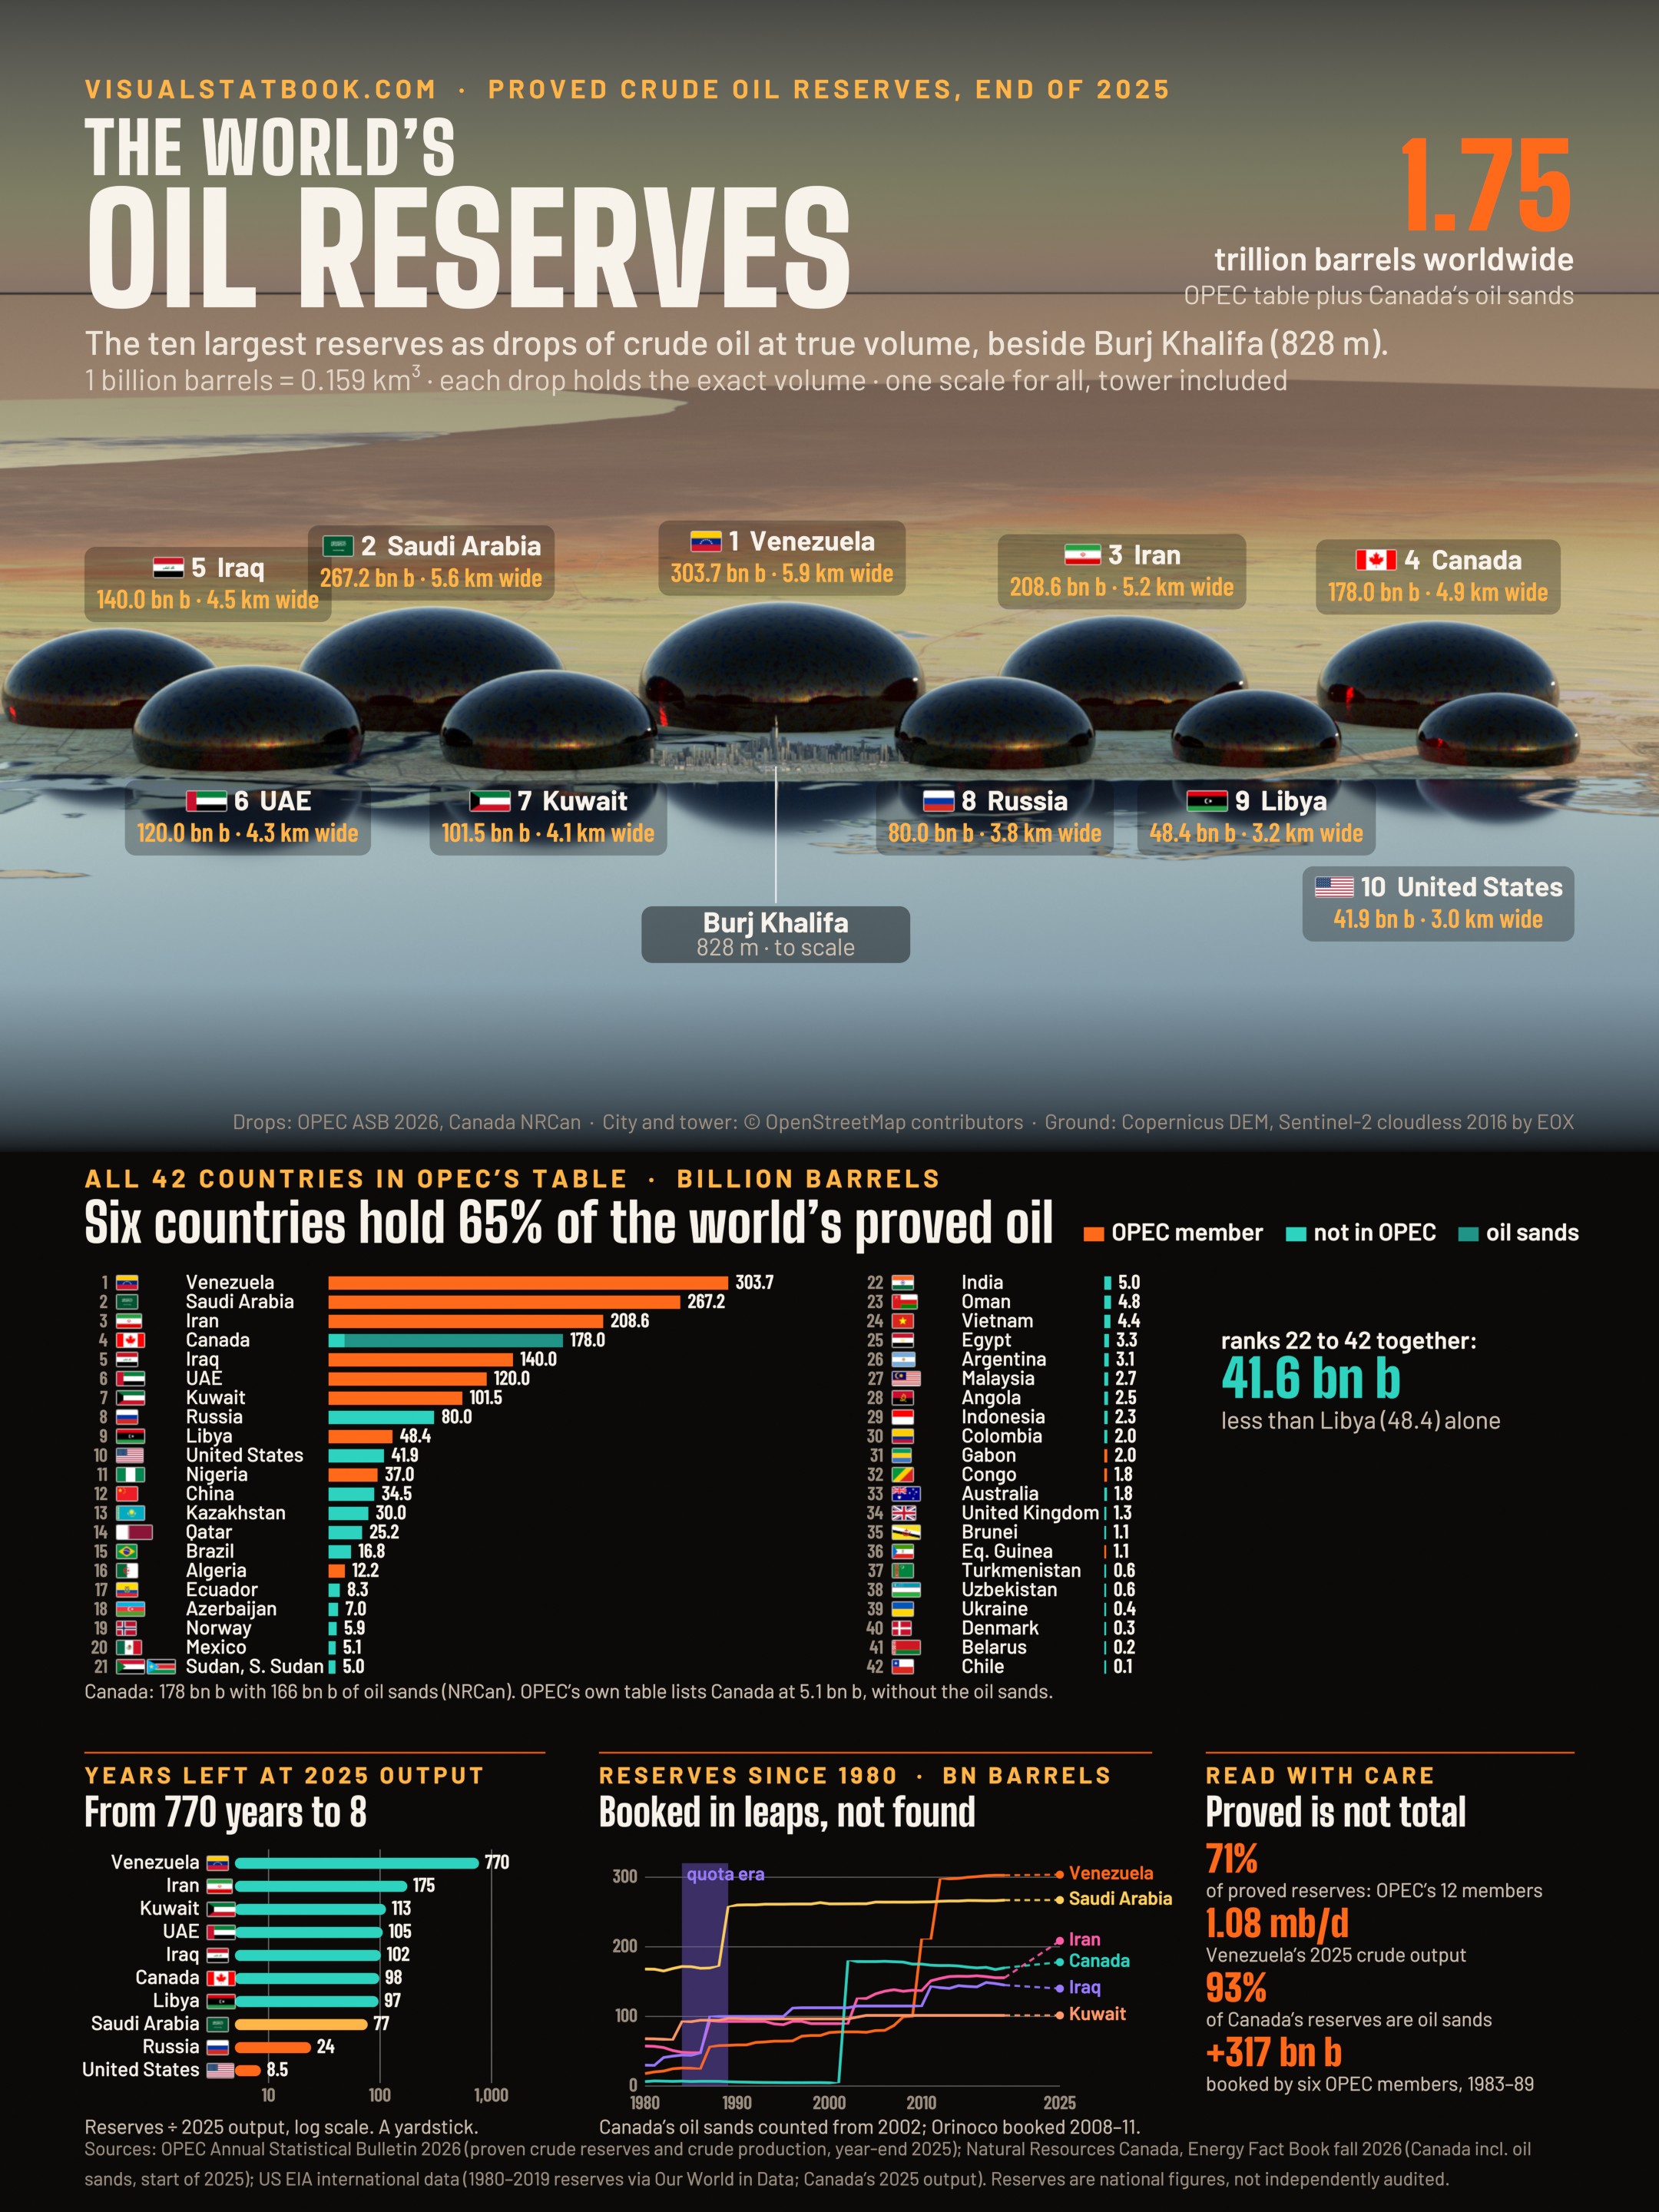
Ten drops of crude at true volume, the full ranking of the 42 countries in OPEC’s table, years left at 2025 output and the jumps since 1980.
| # | Country | Proved reserves, bn barrels | Share of world | Crude output 2025, thousand b/d | Years left | Group | Region |
|---|---|---|---|---|---|---|---|
| 1 | Venezuela | 303.70 | 17.40% | 1,081 | 770 | OPEC | Latin America |
| 2 | Saudi Arabia | 267.20 | 15.31% | 9,480 | 77 | OPEC | Middle East |
| 3 | Iran | 208.60 | 11.95% | 3,263 | 175 | OPEC | Middle East |
| 4 | Canada* | 178.00 | 10.20% | 4,964 | 98 | – | North America |
| 5 | Iraq | 140.00 | 8.02% | 3,775 | 102 | OPEC | Middle East |
| 6 | United Arab Emirates | 120.00 | 6.88% | 3,119 | 105 | OPEC | Middle East |
| 7 | Kuwait | 101.50 | 5.82% | 2,470 | 113 | OPEC | Middle East |
| 8 | Russia | 80.00 | 4.58% | 9,129 | 24 | OPEC+ | Eurasia |
| 9 | Libya | 48.36 | 2.77% | 1,372 | 97 | OPEC | Africa |
| 10 | United States | 41.91 | 2.40% | 13,586 | 8 | – | North America |
| 11 | Nigeria | 37.01 | 2.12% | 1,432 | 71 | OPEC | Africa |
| 12 | China | 34.47 | 1.98% | 4,321 | 22 | – | Asia Pacific |
| 13 | Kazakhstan | 30.00 | 1.72% | 1,778 | 46 | OPEC+ | Eurasia |
| 14 | Qatar | 25.24 | 1.45% | 619 | 112 | – | Middle East |
| 15 | Brazil | 16.84 | 0.96% | 3,660 | 13 | – | Latin America |
| 16 | Algeria | 12.20 | 0.70% | 936 | 36 | OPEC | Africa |
| 17 | Ecuador | 8.27 | 0.47% | 416 | 54 | – | Latin America |
| 18 | Azerbaijan | 7.00 | 0.40% | 460 | 42 | OPEC+ | Eurasia |
| 19 | Norway | 5.92 | 0.34% | 1,840 | 9 | – | Europe |
| 20 | Mexico | 5.14 | 0.29% | 1,465 | 10 | OPEC+ | North America |
| 21 | Sudan and South Sudan | 5.00 | 0.29% | 124 | 110 | OPEC+ | Africa |
| 22 | India | 5.00 | 0.29% | 527 | 26 | – | Asia Pacific |
| 23 | Oman | 4.83 | 0.28% | 775 | 17 | OPEC+ | Middle East |
| 24 | Vietnam | 4.40 | 0.25% | 164 | 74 | – | Asia Pacific |
| 25 | Egypt | 3.30 | 0.19% | 422 | 21 | – | Africa |
| 26 | Argentina | 3.09 | 0.18% | 799 | 11 | – | Latin America |
| 27 | Malaysia | 2.70 | 0.15% | 355 | 21 | OPEC+ | Asia Pacific |
| 28 | Angola | 2.55 | 0.15% | 1,034 | 7 | – | Africa |
| 29 | Indonesia | 2.29 | 0.13% | 522 | 12 | – | Asia Pacific |
| 30 | Colombia | 2.04 | 0.12% | 747 | 8 | – | Latin America |
| 31 | Gabon | 2.00 | 0.11% | 227 | 24 | OPEC | Africa |
| 32 | Congo | 1.81 | 0.10% | 271 | 18 | OPEC | Africa |
| 33 | Australia | 1.80 | 0.10% | 61 | 81 | – | Asia Pacific |
| 34 | United Kingdom | 1.30 | 0.07% | 597 | 6 | – | Europe |
| 35 | Brunei | 1.10 | 0.06% | 83 | 36 | OPEC+ | Asia Pacific |
| 36 | Equatorial Guinea | 1.10 | 0.06% | 46 | 66 | OPEC | Africa |
| 37 | Turkmenistan† | 0.60 | 0.03% | 191 | 9 | – | Eurasia |
| 38 | Uzbekistan† | 0.59 | 0.03% | 30 | 55 | – | Eurasia |
| 39 | Ukraine† | 0.40 | 0.02% | 31 | 35 | – | Eurasia |
| 40 | Denmark | 0.33 | 0.02% | 72 | 13 | – | Europe |
| 41 | Belarus† | 0.20 | 0.01% | 26 | 21 | – | Eurasia |
| 42 | Chile | 0.15 | 0.01% | 2 | 206 | – | Latin America |
Proved crude oil reserves at year-end 2025 (OPEC Annual Statistical Bulletin 2026, Table 3.1); crude output 2025 (Table 3.5). * Canada: 178 bn b remaining established reserves at the start of 2025 including 166 bn b of oil sands (Natural Resources Canada); OPEC lists 5.08 bn b without oil sands. Canada’s output 4,964 thousand b/d is US EIA crude oil including oil sands (OPEC: 1,292). † Output from US EIA. Share of a world total of 1,745 bn b (OPEC’s 1,572 bn b plus Canada’s oil sands). OPEC lumps a further 27 bn b in regional ‘others’.
Questions
Venezuela, with 303.7 billion barrels of proved crude oil reserves at the end of 2025 according to OPEC’s Annual Statistical Bulletin 2026, about 17% of the world total. Most of it is extra-heavy oil in the Orinoco Belt, booked between 2008 and 2011. Saudi Arabia is second with 267.2 billion barrels and Iran third with 208.6.
OPEC puts world proved crude oil reserves at 1,572 billion barrels at the end of 2025. Counting Canada’s oil sands, which OPEC’s table leaves out, the total is about 1,745 billion barrels: roughly 61 years of output at the 2025 rate. Proved reserves are only the part judged recoverable today; the oil in the ground is much larger.
Because of the oil sands. Natural Resources Canada reports 178 billion barrels of remaining established reserves, 166 billion of them in the oil sands, which puts Canada fourth. OPEC’s table counts only 5.1 billion barrels without the oil sands.
At 2025 production and with no new reserves, Venezuela’s reserves would last about 770 years, Iran’s 175, Saudi Arabia’s 77, Russia’s 24 and the United States’ about 8.5. These reserves-to-production ratios are a yardstick: reserves are revised and production changes.
One billion barrels is 0.159 km³. Poured out as a single drop (a flattened sphere 0.4 times as tall as it is wide), Venezuela’s 303.7 billion barrels would be 5.9 km wide and 2.4 km tall, about three times the 828 m height of Burj Khalifa. As a cube it would measure 3.64 km on each side. All the world’s 1,745 billion barrels would make a drop about 11 km wide.
Between 1984 and 1989 Kuwait, Iran, Iraq, the UAE, Venezuela and Saudi Arabia raised their stated reserves by large steps, at a time when OPEC was weighing reserves in its production quotas. The increases came with few reported new discoveries, and many figures have barely changed since despite decades of production, so analysts treat them with caution.
Sources. Reserves and crude production: OPEC Annual Statistical Bulletin 2026, Tables 3.1 and 3.5 (year-end 2025). Canada including oil sands: Natural Resources Canada, Energy Fact Book fall 2026 (remaining established reserves, start of 2025). Canada’s 2025 crude output and the four countries OPEC does not itemise: US EIA International Energy Data. Reserves 1980–2019: US EIA international data (Oil & Gas Journal), via Our World in Data. Accessed 21 October 2026.
Maps and models. Borders and map: Natural Earth (public domain). Relief: NOAA NCEI ETOPO 2022 15″; Copernicus DEM GLO-30 (© DLR e.V. 2010–2014 and © Airbus Defence and Space GmbH 2014–2018, provided under COPERNICUS by the European Union and ESA). Land colour: Sentinel-2 cloudless by EOX IT Services GmbH (contains modified Copernicus Sentinel data 2016), CC BY 4.0. Buildings and Burj Khalifa: © OpenStreetMap contributors (ODbL). Flags: Wikimedia Commons (public domain).