


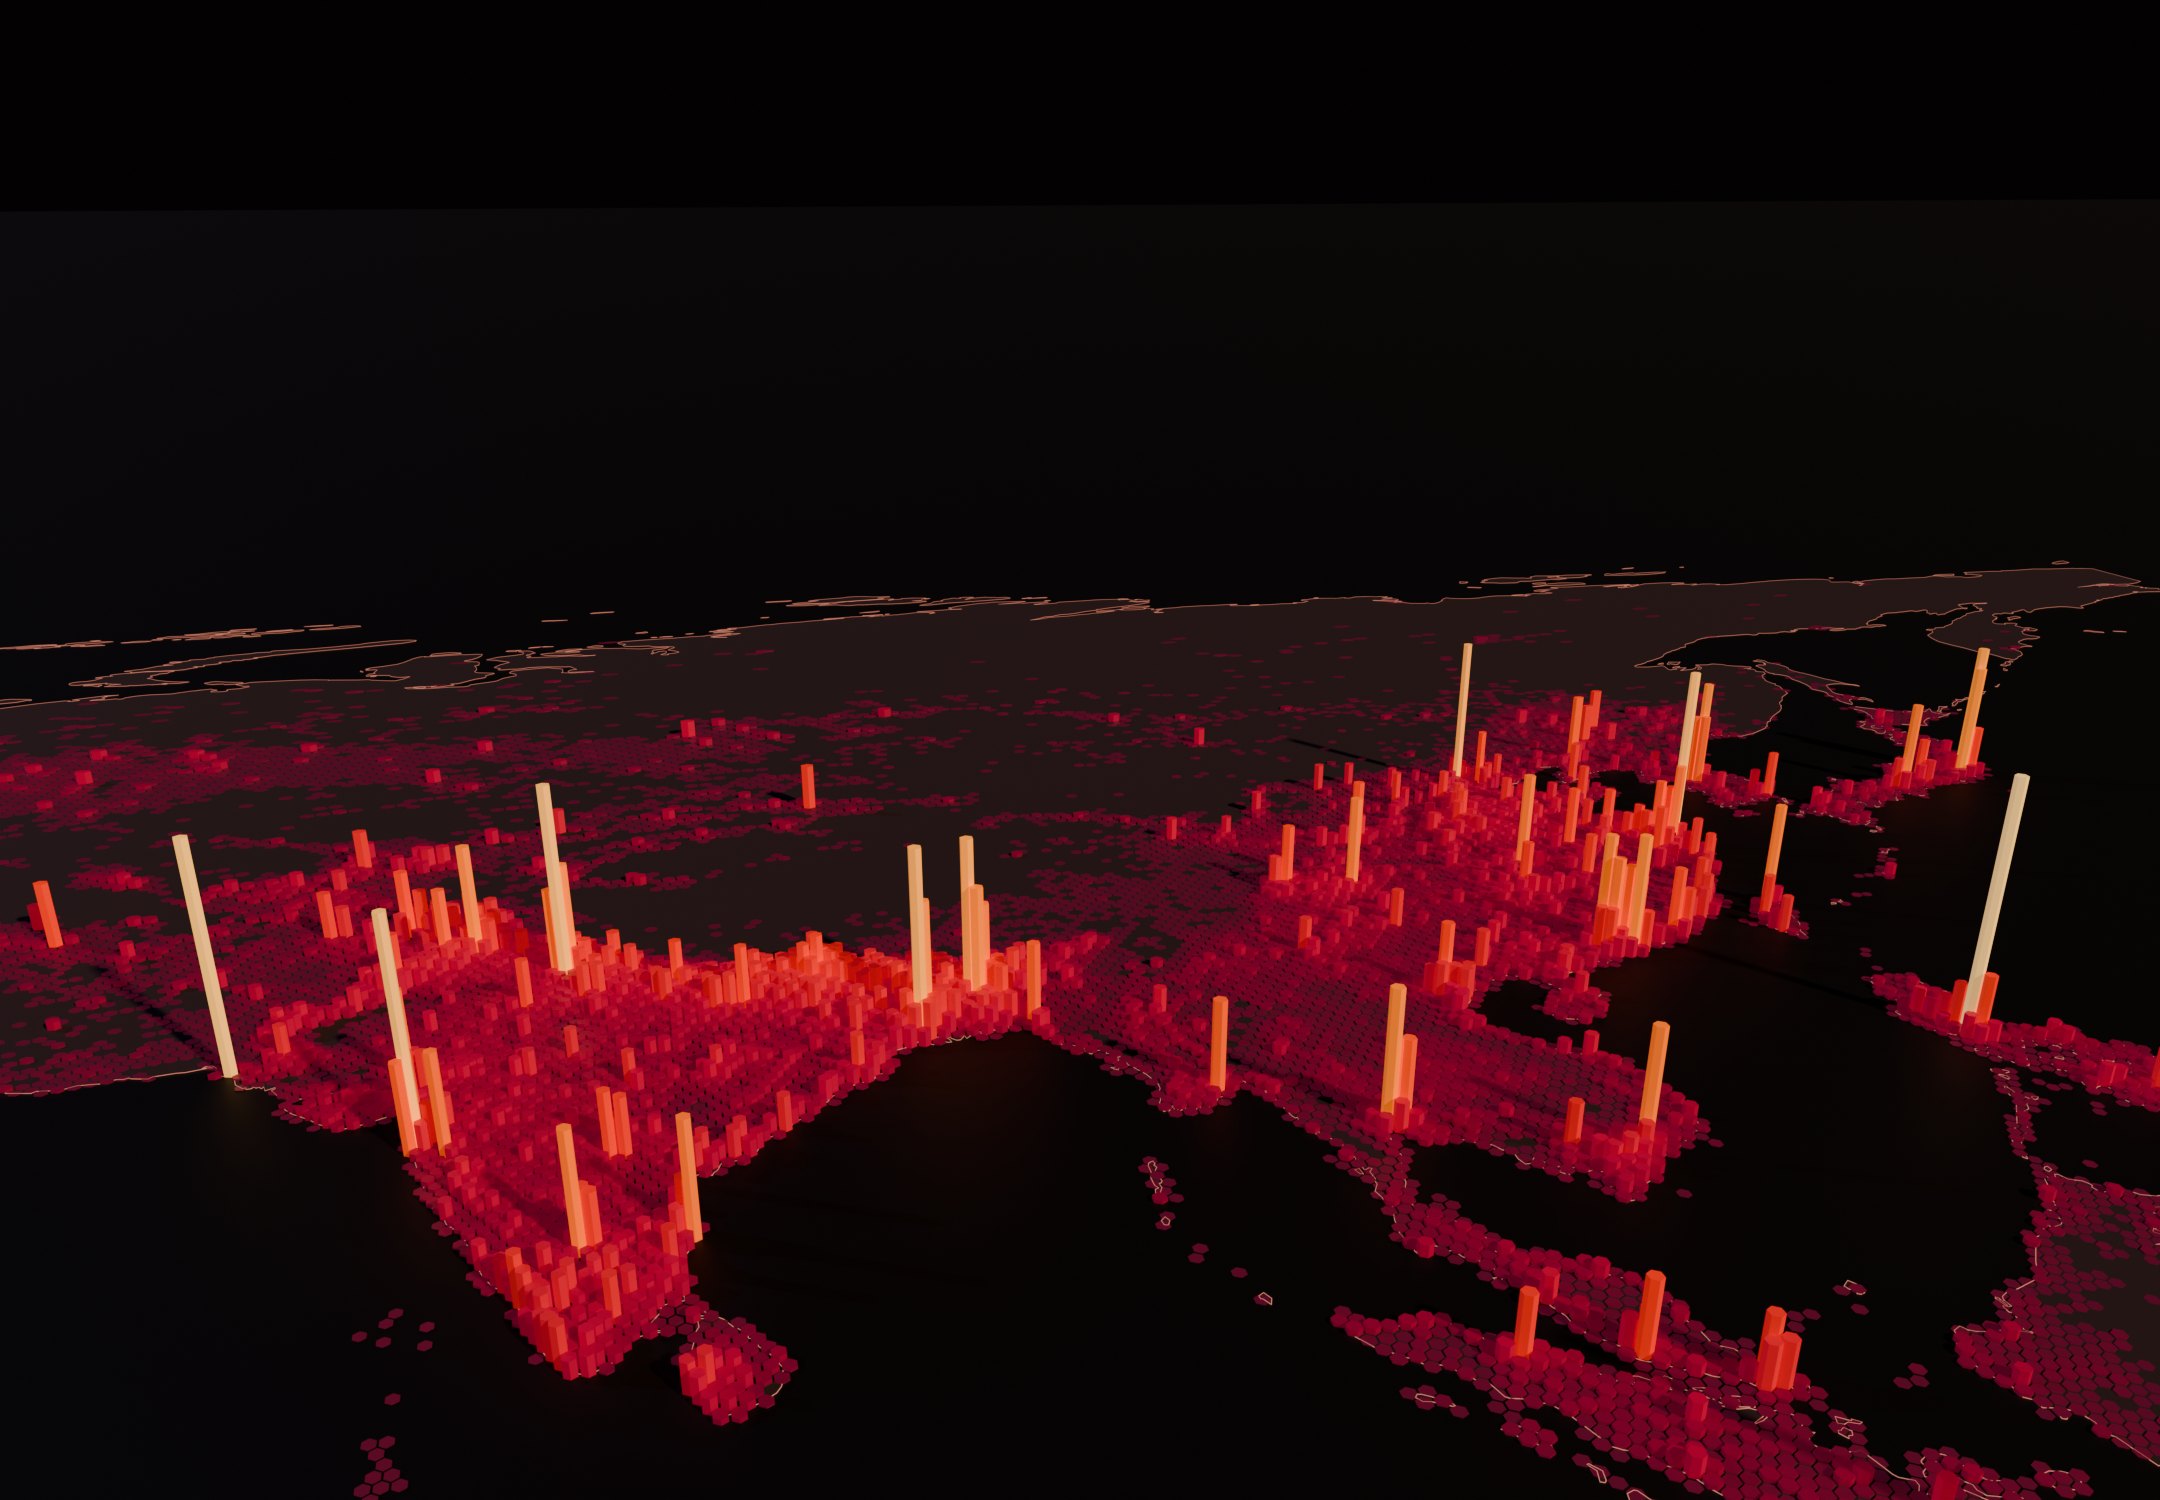
1950 to 2100
The population race
Drag through 150 years of UN estimates and projections. China led for seven decades; India took over in 2022, and Africa’s giants climb fast after 2050.
India and China
The crossing
Any country
Where does it rank?
Pick any of the 195 countries to see its size today, where it will rank in 2050 and 2100, and when its population peaks.
If the world were 100 people
Over a third are Indian or Chinese
Data
All 195 countries
| # | Country | 2026 | Share | 2050 | 2100 | Change to 2100 |
|---|---|---|---|---|---|---|
| 1 | India | 1.48 bn | 17.79% | 1.68 bn | 1.51 bn | +2% |
| 2 | China | 1.41 bn | 17.02% | 1.26 bn | 633.4 M | -55% |
| 3 | United States | 349.0 M | 4.20% | 380.8 M | 421.3 M | +21% |
| 4 | Indonesia | 287.9 M | 3.47% | 320.7 M | 295.5 M | +3% |
| 5 | Pakistan | 259.3 M | 3.12% | 371.9 M | 511.0 M | +97% |
| 6 | Nigeria | 242.4 M | 2.92% | 359.2 M | 476.7 M | +97% |
| 7 | Brazil | 213.6 M | 2.57% | 217.5 M | 163.4 M | -24% |
| 8 | Bangladesh | 177.8 M | 2.14% | 214.7 M | 208.6 M | +17% |
| 9 | Russia | 143.4 M | 1.73% | 136.1 M | 126.4 M | -12% |
| 10 | Ethiopia | 138.9 M | 1.67% | 225.0 M | 367.3 M | +164% |
| 11 | Mexico | 133.0 M | 1.60% | 148.9 M | 130.2 M | -2% |
| 12 | Japan | 122.4 M | 1.47% | 105.1 M | 76.8 M | -37% |
| 13 | Egypt | 120.1 M | 1.45% | 161.6 M | 201.9 M | +68% |
| 14 | Philippines | 117.7 M | 1.42% | 134.4 M | 114.2 M | -3% |
| 15 | DR Congo | 116.5 M | 1.40% | 218.2 M | 430.7 M | +270% |
| 16 | Vietnam | 102.2 M | 1.23% | 110.0 M | 91.7 M | -10% |
| 17 | Iran | 93.2 M | 1.12% | 101.9 M | 80.0 M | -14% |
| 18 | Turkey | 87.9 M | 1.06% | 91.3 M | 65.3 M | -26% |
| 19 | Germany | 83.6 M | 1.01% | 78.3 M | 70.9 M | -15% |
| 20 | Tanzania | 72.6 M | 0.87% | 129.6 M | 262.8 M | +262% |
| 21 | Thailand | 71.6 M | 0.86% | 66.4 M | 45.6 M | -36% |
| 22 | United Kingdom | 69.9 M | 0.84% | 75.5 M | 74.3 M | +6% |
| 23 | France | 66.7 M | 0.80% | 68.2 M | 68.5 M | +3% |
| 24 | South Africa | 65.5 M | 0.79% | 79.2 M | 94.3 M | +44% |
| 25 | Italy | 58.9 M | 0.71% | 51.9 M | 35.4 M | -40% |
| 26 | Kenya | 58.6 M | 0.71% | 83.6 M | 104.2 M | +78% |
| 27 | Myanmar | 55.2 M | 0.66% | 58.6 M | 49.7 M | -10% |
| 28 | Colombia | 53.9 M | 0.65% | 59.4 M | 47.1 M | -13% |
| 29 | Sudan | 53.3 M | 0.64% | 85.2 M | 136.9 M | +157% |
| 30 | Uganda | 52.8 M | 0.64% | 85.4 M | 120.8 M | +129% |
| 31 | South Korea | 51.6 M | 0.62% | 45.1 M | 21.8 M | -58% |
| 32 | Algeria | 48.0 M | 0.58% | 59.6 M | 64.5 M | +34% |
| 33 | Iraq | 48.0 M | 0.58% | 71.9 M | 100.6 M | +110% |
| 34 | Spain | 47.9 M | 0.58% | 44.9 M | 33.1 M | -31% |
| 35 | Argentina | 46.0 M | 0.55% | 48.3 M | 38.3 M | -17% |
| 36 | Afghanistan | 45.0 M | 0.54% | 76.9 M | 130.2 M | +189% |
| 37 | Yemen | 43.0 M | 0.52% | 71.0 M | 110.0 M | +156% |
| 38 | Canada | 40.5 M | 0.49% | 45.6 M | 53.6 M | +32% |
| 39 | Angola | 40.2 M | 0.48% | 74.3 M | 150.0 M | +273% |
| 40 | Ukraine | 39.5 M | 0.48% | 32.0 M | 15.2 M | -62% |
| 41 | Morocco | 38.8 M | 0.47% | 43.4 M | 37.9 M | -2% |
| 42 | Poland | 37.8 M | 0.46% | 32.8 M | 19.3 M | -49% |
| 43 | Uzbekistan | 37.7 M | 0.45% | 52.2 M | 74.4 M | +97% |
| 44 | Mozambique | 36.6 M | 0.44% | 63.5 M | 104.3 M | +185% |
| 45 | Malaysia | 36.4 M | 0.44% | 44.3 M | 44.0 M | +21% |
| 46 | Ghana | 35.7 M | 0.43% | 50.6 M | 67.5 M | +89% |
| 47 | Saudi Arabia | 35.2 M | 0.42% | 47.7 M | 71.0 M | +102% |
| 48 | Peru | 34.9 M | 0.42% | 40.6 M | 38.2 M | +9% |
| 49 | Madagascar | 33.5 M | 0.40% | 53.2 M | 85.3 M | +155% |
| 50 | Cote d'Ivoire | 33.5 M | 0.40% | 55.7 M | 104.0 M | +211% |
| 51 | Cameroon | 30.6 M | 0.37% | 51.1 M | 88.9 M | +190% |
| 52 | Nepal | 29.6 M | 0.36% | 34.6 M | 31.8 M | +7% |
| 53 | Niger | 28.8 M | 0.35% | 52.5 M | 90.8 M | +215% |
| 54 | Venezuela | 28.6 M | 0.34% | 31.1 M | 28.3 M | -1% |
| 55 | Australia | 27.2 M | 0.33% | 32.5 M | 43.1 M | +58% |
| 56 | North Korea | 26.6 M | 0.32% | 25.8 M | 19.5 M | -27% |
| 57 | Syria | 26.5 M | 0.32% | 37.8 M | 43.7 M | +65% |
| 58 | Mali | 25.9 M | 0.31% | 46.2 M | 79.4 M | +206% |
| 59 | Burkina Faso | 24.6 M | 0.30% | 37.3 M | 49.9 M | +103% |
| 60 | Sri Lanka | 23.3 M | 0.28% | 24.8 M | 21.2 M | -9% |
| 61 | Malawi | 22.8 M | 0.27% | 37.4 M | 59.1 M | +160% |
| 62 | Zambia | 22.5 M | 0.27% | 38.1 M | 64.5 M | +186% |
| 63 | Chad | 21.6 M | 0.26% | 38.9 M | 69.5 M | +223% |
| 64 | Kazakhstan | 21.1 M | 0.25% | 26.5 M | 33.7 M | +60% |
| 65 | Somalia | 20.3 M | 0.24% | 37.2 M | 67.4 M | +232% |
| 66 | Chile | 19.9 M | 0.24% | 20.3 M | 13.4 M | -33% |
| 67 | Senegal | 19.4 M | 0.23% | 30.4 M | 47.0 M | +143% |
| 68 | Guatemala | 19.0 M | 0.23% | 24.7 M | 25.9 M | +37% |
| 69 | Romania | 18.8 M | 0.23% | 16.0 M | 10.8 M | -43% |
| 70 | Netherlands | 18.4 M | 0.22% | 19.0 M | 17.5 M | -5% |
| 71 | Ecuador | 18.4 M | 0.22% | 21.3 M | 19.1 M | +4% |
| 72 | Cambodia | 18.1 M | 0.22% | 21.9 M | 22.7 M | +26% |
| 73 | Zimbabwe | 17.3 M | 0.21% | 25.9 M | 37.2 M | +115% |
| 74 | Guinea | 15.4 M | 0.19% | 23.4 M | 32.0 M | +107% |
| 75 | Benin | 15.2 M | 0.18% | 24.4 M | 39.6 M | +161% |
| 76 | Rwanda | 14.9 M | 0.18% | 22.7 M | 32.8 M | +120% |
| 77 | Burundi | 14.7 M | 0.18% | 24.1 M | 37.9 M | +157% |
| 78 | Bolivia | 12.7 M | 0.15% | 16.1 M | 17.8 M | +39% |
| 79 | South Sudan | 12.4 M | 0.15% | 18.3 M | 23.8 M | +92% |
| 80 | Tunisia | 12.4 M | 0.15% | 13.1 M | 10.7 M | -14% |
| 81 | Haiti | 12.0 M | 0.15% | 14.7 M | 15.2 M | +26% |
| 82 | Belgium | 11.8 M | 0.14% | 11.9 M | 11.1 M | -6% |
| 83 | Dominican Republic | 11.6 M | 0.14% | 13.0 M | 11.7 M | +1% |
| 84 | Jordan | 11.6 M | 0.14% | 16.4 M | 21.3 M | +84% |
| 85 | United Arab Emirates | 11.6 M | 0.14% | 15.4 M | 26.1 M | +126% |
| 86 | Honduras | 11.2 M | 0.13% | 14.8 M | 17.0 M | +52% |
| 87 | Tajikistan | 11.0 M | 0.13% | 15.6 M | 20.2 M | +84% |
| 88 | Papua New Guinea | 10.9 M | 0.13% | 14.9 M | 18.6 M | +70% |
| 89 | Cuba | 10.9 M | 0.13% | 9.4 M | 5.6 M | -49% |
| 90 | Sweden | 10.7 M | 0.13% | 11.3 M | 11.4 M | +6% |
| 91 | Czechia | 10.5 M | 0.13% | 9.8 M | 8.2 M | -22% |
| 92 | Azerbaijan | 10.5 M | 0.13% | 11.2 M | 10.0 M | -4% |
| 93 | Portugal | 10.4 M | 0.13% | 9.8 M | 8.8 M | -16% |
| 94 | Greece | 9.9 M | 0.12% | 8.8 M | 6.3 M | -37% |
| 95 | Israel | 9.6 M | 0.12% | 13.1 M | 19.7 M | +105% |
| 96 | Hungary | 9.6 M | 0.12% | 8.7 M | 7.5 M | -22% |
| 97 | Austria | 9.1 M | 0.11% | 8.7 M | 7.4 M | -19% |
| 98 | Switzerland | 9.0 M | 0.11% | 9.3 M | 9.1 M | +1% |
| 99 | Sierra Leone | 9.0 M | 0.11% | 12.9 M | 15.9 M | +77% |
| 100 | Belarus | 8.9 M | 0.11% | 7.5 M | 4.4 M | -51% |
| 101 | Togo | 8.8 M | 0.11% | 14.0 M | 23.6 M | +169% |
| 102 | Laos | 8.0 M | 0.10% | 9.8 M | 9.3 M | +16% |
| 103 | Turkmenistan | 7.7 M | 0.09% | 9.6 M | 9.9 M | +29% |
| 104 | Libya | 7.5 M | 0.09% | 9.3 M | 9.8 M | +30% |
| 105 | Kyrgyzstan | 7.4 M | 0.09% | 9.6 M | 11.7 M | +59% |
| 106 | Nicaragua | 7.1 M | 0.09% | 8.8 M | 8.6 M | +21% |
| 107 | Paraguay | 7.1 M | 0.09% | 8.6 M | 9.0 M | +28% |
| 108 | Bulgaria | 6.7 M | 0.08% | 5.4 M | 3.5 M | -47% |
| 109 | Serbia | 6.6 M | 0.08% | 5.5 M | 3.7 M | -44% |
| 110 | Congo | 6.6 M | 0.08% | 11.0 M | 20.0 M | +202% |
| 111 | El Salvador | 6.4 M | 0.08% | 6.7 M | 5.1 M | -21% |
| 112 | Denmark | 6.0 M | 0.07% | 6.1 M | 5.9 M | -3% |
| 113 | Singapore | 5.9 M | 0.07% | 6.1 M | 4.2 M | -30% |
| 114 | Lebanon | 5.9 M | 0.07% | 7.0 M | 7.2 M | +22% |
| 115 | Liberia | 5.9 M | 0.07% | 8.9 M | 12.7 M | +116% |
| 116 | Central African Rep. | 5.7 M | 0.07% | 10.6 M | 18.8 M | +230% |
| 117 | Palestine | 5.7 M | 0.07% | 8.5 M | 11.5 M | +102% |
| 118 | Oman | 5.7 M | 0.07% | 7.8 M | 12.1 M | +113% |
| 119 | Norway | 5.7 M | 0.07% | 5.9 M | 5.4 M | -4% |
| 120 | Finland | 5.6 M | 0.07% | 5.4 M | 4.6 M | -18% |
| 121 | Mauritania | 5.5 M | 0.07% | 9.4 M | 17.1 M | +213% |
| 122 | Slovakia | 5.5 M | 0.07% | 4.9 M | 3.4 M | -37% |
| 123 | Ireland | 5.4 M | 0.06% | 6.0 M | 5.3 M | -1% |
| 124 | New Zealand | 5.3 M | 0.06% | 5.8 M | 5.8 M | +10% |
| 125 | Costa Rica | 5.2 M | 0.06% | 5.4 M | 3.8 M | -27% |
| 126 | Kuwait | 5.1 M | 0.06% | 6.4 M | 9.6 M | +88% |
| 127 | Panama | 4.6 M | 0.06% | 5.6 M | 5.9 M | +28% |
| 128 | Croatia | 3.8 M | 0.05% | 3.2 M | 2.1 M | -44% |
| 129 | Georgia | 3.8 M | 0.05% | 3.7 M | 3.0 M | -22% |
| 130 | Eritrea | 3.7 M | 0.04% | 5.7 M | 8.4 M | +129% |
| 131 | Mongolia | 3.6 M | 0.04% | 4.5 M | 5.5 M | +55% |
| 132 | Uruguay | 3.4 M | 0.04% | 3.3 M | 2.2 M | -34% |
| 133 | Qatar | 3.2 M | 0.04% | 4.2 M | 7.3 M | +129% |
| 134 | Namibia | 3.2 M | 0.04% | 4.5 M | 5.9 M | +87% |
| 135 | Bosnia & Herzegovina | 3.1 M | 0.04% | 2.5 M | 1.4 M | -56% |
| 136 | Moldova | 3.0 M | 0.04% | 2.4 M | 1.5 M | -50% |
| 137 | Armenia | 2.9 M | 0.04% | 2.5 M | 1.7 M | -42% |
| 138 | Gambia | 2.9 M | 0.03% | 4.3 M | 5.7 M | +98% |
| 139 | Jamaica | 2.8 M | 0.03% | 2.5 M | 1.1 M | -62% |
| 140 | Lithuania | 2.8 M | 0.03% | 2.3 M | 1.2 M | -57% |
| 141 | Albania | 2.8 M | 0.03% | 2.2 M | 1.2 M | -57% |
| 142 | Gabon | 2.6 M | 0.03% | 4.1 M | 6.9 M | +161% |
| 143 | Botswana | 2.6 M | 0.03% | 3.4 M | 3.8 M | +47% |
| 144 | Lesotho | 2.4 M | 0.03% | 3.0 M | 3.3 M | +36% |
| 145 | Guinea-Bissau | 2.3 M | 0.03% | 3.4 M | 4.7 M | +103% |
| 146 | Slovenia | 2.1 M | 0.03% | 2.0 M | 1.6 M | -23% |
| 147 | Equatorial Guinea | 2.0 M | 0.02% | 3.1 M | 5.0 M | +152% |
| 148 | Latvia | 1.8 M | 0.02% | 1.5 M | 0.9 M | -50% |
| 149 | North Macedonia | 1.8 M | 0.02% | 1.5 M | 0.9 M | -52% |
| 150 | Bahrain | 1.7 M | 0.02% | 2.1 M | 3.1 M | +84% |
| 151 | Trinidad & Tobago | 1.5 M | 0.02% | 1.4 M | 0.9 M | -41% |
| 152 | Timor-Leste | 1.4 M | 0.02% | 1.9 M | 2.0 M | +37% |
| 153 | Cyprus | 1.4 M | 0.02% | 1.5 M | 1.3 M | -8% |
| 154 | Estonia | 1.3 M | 0.02% | 1.2 M | 0.8 M | -38% |
| 155 | Eswatini | 1.3 M | 0.02% | 1.5 M | 1.3 M | +6% |
| 156 | Mauritius | 1.3 M | 0.02% | 1.1 M | 0.6 M | -54% |
| 157 | Djibouti | 1.2 M | 0.01% | 1.5 M | 1.8 M | +54% |
| 158 | Fiji | 0.9 M | 0.01% | 1.0 M | 0.9 M | -6% |
| 159 | Comoros | 0.9 M | 0.01% | 1.3 M | 1.9 M | +113% |
| 160 | Solomon Islands | 0.9 M | 0.01% | 1.3 M | 1.8 M | +115% |
| 161 | Guyana | 0.8 M | 0.01% | 0.9 M | 0.9 M | +6% |
| 162 | Bhutan | 0.8 M | 0.01% | 0.9 M | 0.7 M | -14% |
| 163 | Luxembourg | 0.7 M | 0.01% | 0.8 M | 0.7 M | +9% |
| 164 | Suriname | 0.6 M | 0.01% | 0.7 M | 0.7 M | +10% |
| 165 | Montenegro | 0.6 M | 0.01% | 0.5 M | 0.3 M | -48% |
| 166 | Malta | 0.5 M | 0.01% | 0.5 M | 0.4 M | -34% |
| 167 | Maldives | 0.5 M | 0.01% | 0.6 M | 0.5 M | -11% |
| 168 | Cape Verde | 0.5 M | 0.01% | 0.6 M | 0.4 M | -21% |
| 169 | Brunei | 0.5 M | 0.01% | 0.5 M | 0.5 M | -1% |
| 170 | Belize | 0.4 M | 0.01% | 0.5 M | 0.4 M | +4% |
| 171 | Bahamas | 0.4 M | 0.00% | 0.4 M | 0.4 M | -5% |
| 172 | Iceland | 0.4 M | 0.00% | 0.4 M | 0.4 M | -10% |
| 173 | Vanuatu | 0.3 M | 0.00% | 0.5 M | 0.9 M | +156% |
| 174 | Barbados | 0.3 M | 0.00% | 0.3 M | 0.2 M | -31% |
| 175 | São Tomé & Príncipe | 0.2 M | 0.00% | 0.4 M | 0.5 M | +118% |
| 176 | Samoa | 0.2 M | 0.00% | 0.3 M | 0.4 M | +74% |
| 177 | Saint Lucia | 0.2 M | 0.00% | 0.2 M | 0.1 M | -40% |
| 178 | Kiribati | 0.1 M | 0.00% | 0.2 M | 0.2 M | +61% |
| 179 | Seychelles | 0.1 M | 0.00% | 0.1 M | 0.1 M | -14% |
| 180 | Grenada | 0.1 M | 0.00% | 0.1 M | 0.1 M | -37% |
| 181 | Micronesia (country) | 0.1 M | 0.00% | 0.1 M | 0.1 M | +12% |
| 182 | Tonga | 0.1 M | 0.00% | 0.1 M | 0.1 M | +14% |
| 183 | St Vincent & Grenadines | 0.1 M | 0.00% | 0.1 M | 0.1 M | -35% |
| 184 | Antigua & Barbuda | 0.1 M | 0.00% | 0.1 M | 0.1 M | -28% |
| 185 | Andorra | 0.1 M | 0.00% | 0.1 M | 0.0 M | -44% |
| 186 | Dominica | 0.1 M | 0.00% | 0.1 M | 0.0 M | -25% |
| 187 | St Kitts & Nevis | 0.0 M | 0.00% | 0.0 M | 0.0 M | -36% |
| 188 | Liechtenstein | 0.0 M | 0.00% | 0.0 M | 0.0 M | +8% |
| 189 | Monaco | 0.0 M | 0.00% | 0.0 M | 0.0 M | +25% |
| 190 | Marshall Islands | 0.0 M | 0.00% | 0.0 M | 0.0 M | -32% |
| 191 | San Marino | 0.0 M | 0.00% | 0.0 M | 0.0 M | -7% |
| 192 | Palau | 0.0 M | 0.00% | 0.0 M | 0.0 M | -37% |
| 193 | Nauru | 0.0 M | 0.00% | 0.0 M | 0.0 M | +71% |
| 194 | Tuvalu | 0.0 M | 0.00% | 0.0 M | 0.0 M | +31% |
| 195 | Vatican | 0.0 M | 0.00% | 0.0 M | 0.0 M | +164% |
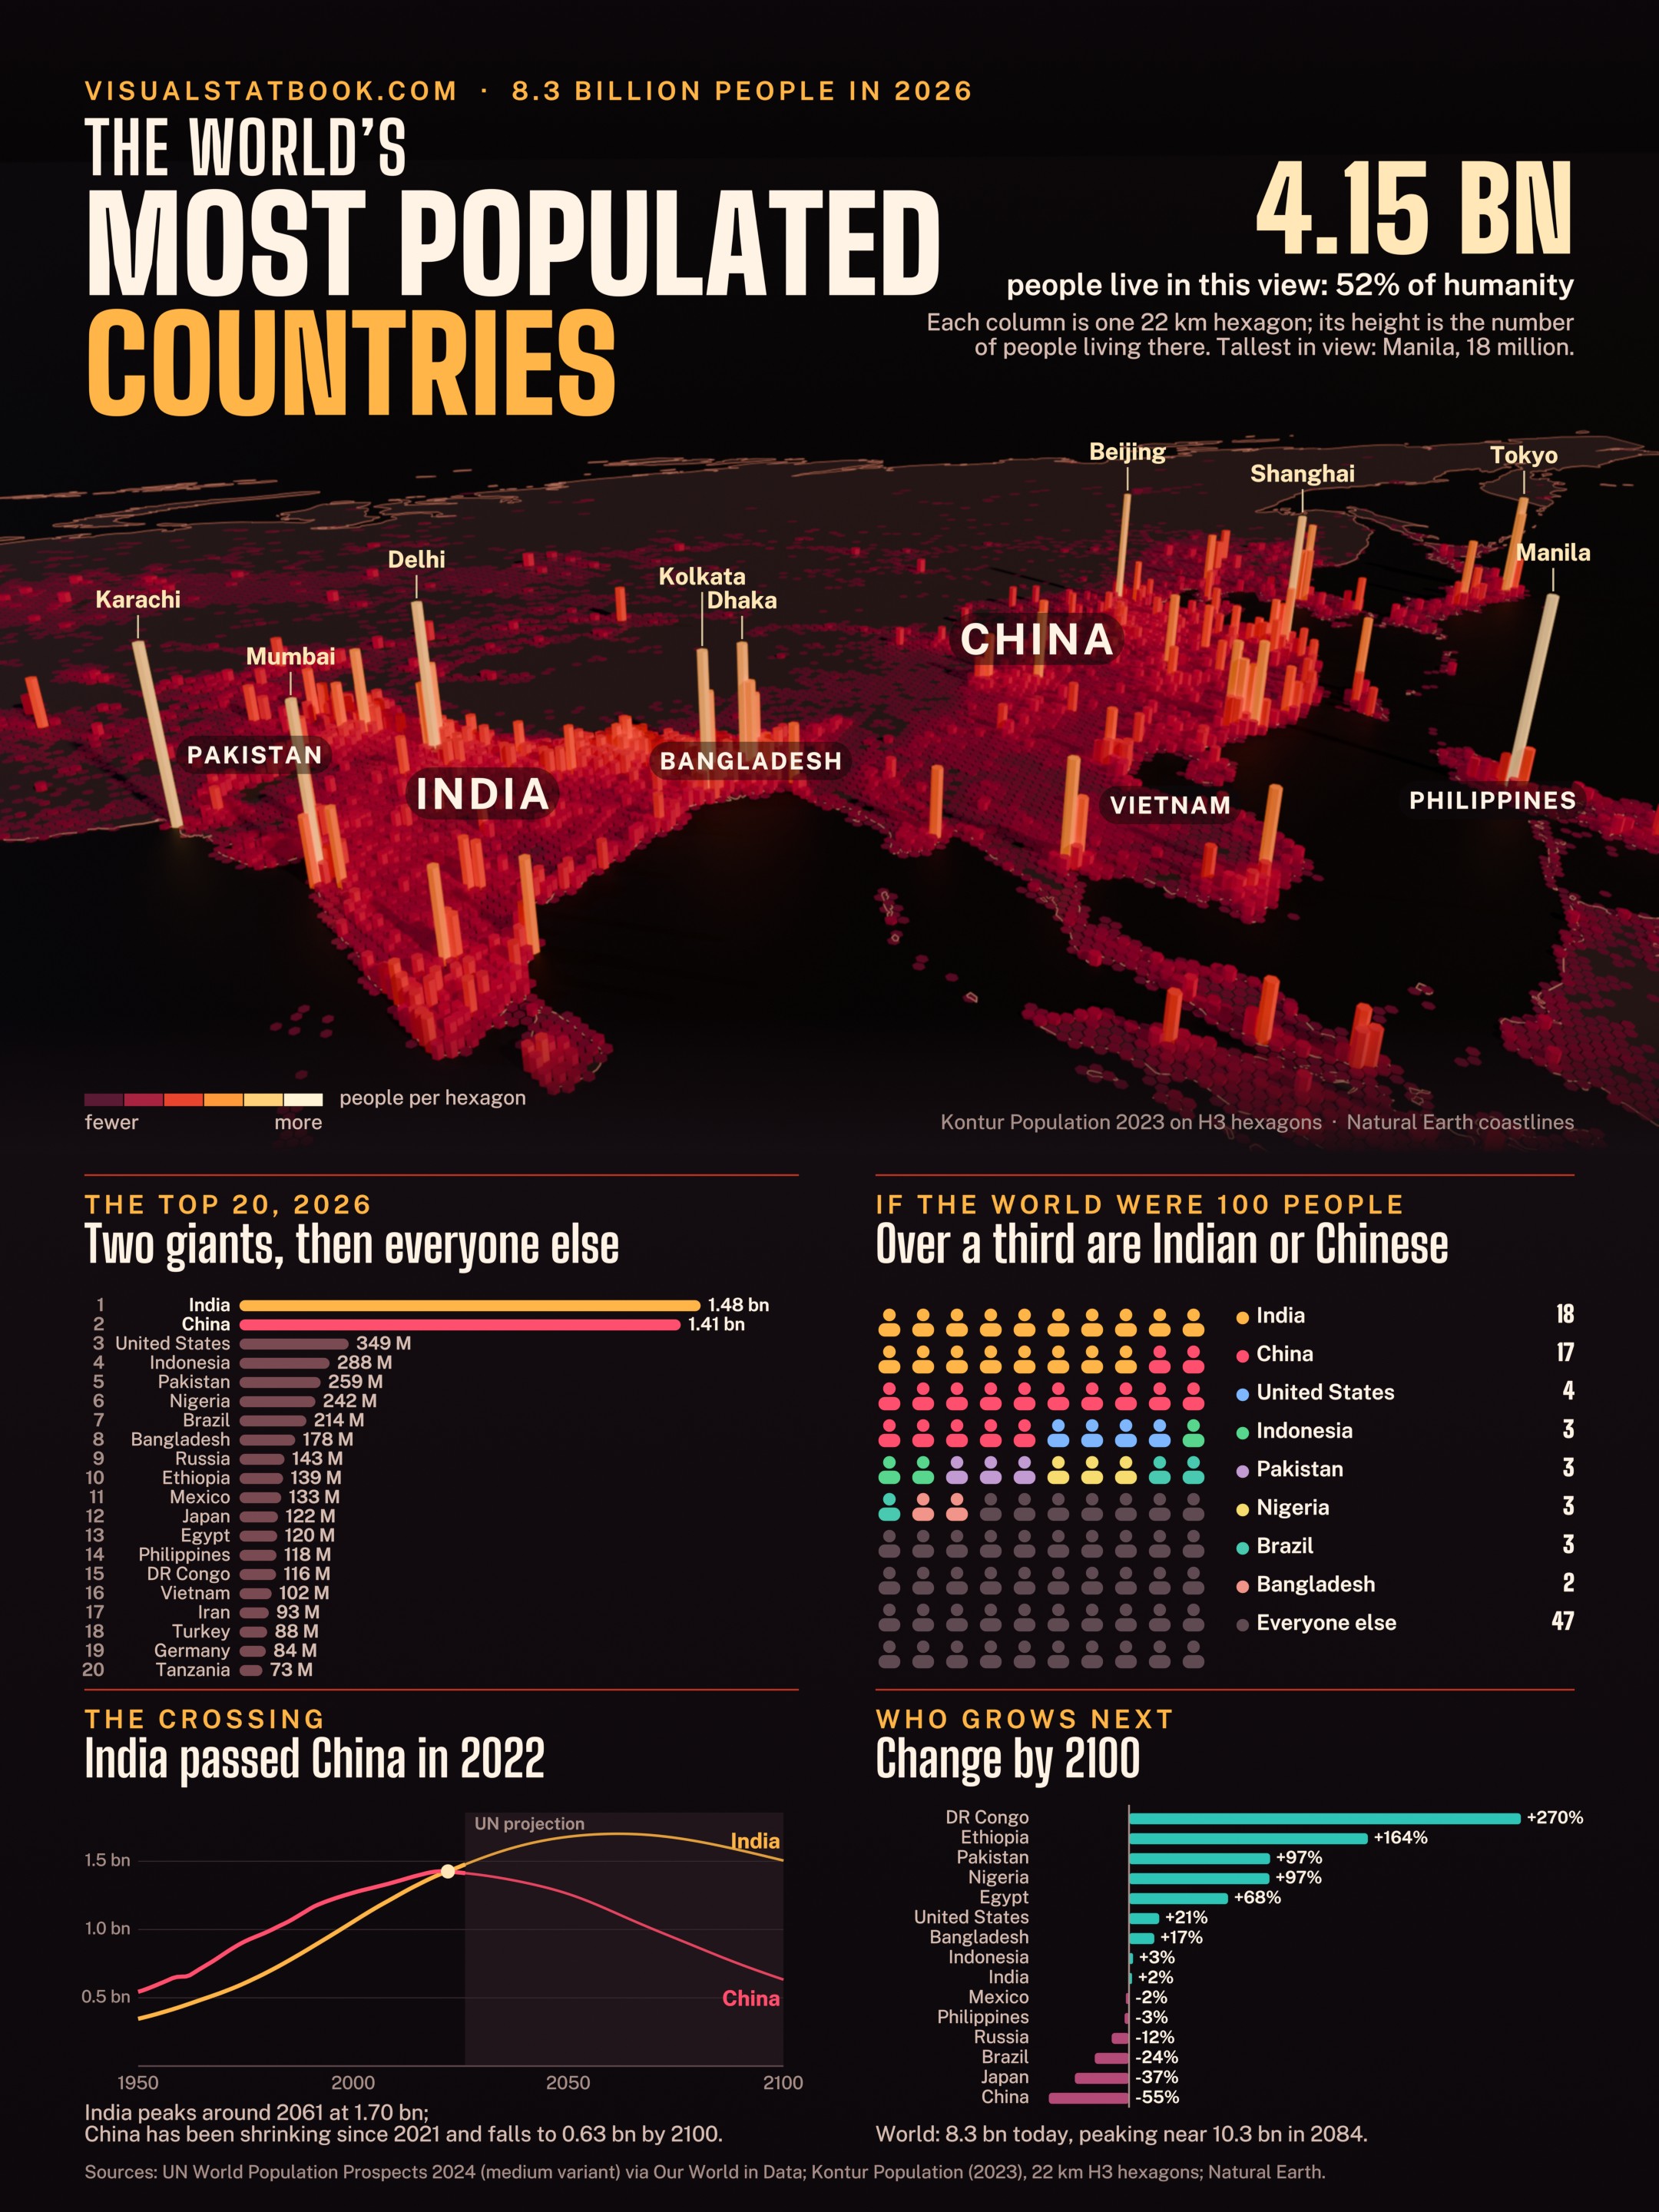
The poster
Eight billion on one page
The hexagon map, the top 20, the world as 100 people, the India–China crossing and who grows next, on a 2160 × 2880 poster.
Open the full-size posterQuestions
Population FAQ
What is the most populated country in the world?
India, with about 1.48 billion people in 2026, followed by China with about 1.41 billion (UN World Population Prospects 2024).
When did India overtake China?
In 2022, by the UN’s latest estimates. China’s population peaked in 2021 and is now shrinking.
What is the world population in 2026?
About 8.3 billion. The UN projects a peak of about 10.3 billion in the mid-2080s.
Which countries will grow the most by 2100?
Among today’s 15 largest, DR Congo (+270%), Ethiopia (+164%), Pakistan and Nigeria (both about +97%) grow fastest under the UN’s medium projection.
Which large countries are shrinking?
China is projected to fall by more than half by 2100, Japan by over a third, and Brazil and Russia are also expected to decline.
How many of the world’s people live in Asia?
About 4.8 billion, close to six in ten people. Our map shows 4.15 billion living within a single view from Pakistan to Japan.