Skip to content

Home Maritime Chokepoints

    Loading the globe…

    The world’s key maritime chokepoints · 28 straits and canals Where world trade squeezes through

    More than 80% of the world’s goods travel by sea, and much of it funnels through a few narrow straits and canals. Each pillar on this globe stands on one of the 28 tracked by IMF PortWatch, as tall as the cargo that passed through in 2025. Scroll to sail from the Strait of Malacca to the Red Sea, Hormuz, Panama and Europe’s gates.

    28chokepoints tracked
    3.31 bn tthrough Malacca, 2025
    −92%ships through Hormuz since the war

    ↓ Scroll to begin the voyage

    1°31′N 102°40′E · Strait of Malacca

    The busiest lane on Earth

    Between Malaysia and Sumatra, the Strait of Malacca carried 3.31 billion tonnes of cargo in 2025, more than any other chokepoint. Next door, the Taiwan Strait saw the most ships: about 239 a day.

    Cargo in 2025, billion tonnes · IMF PortWatch
    12°47′N 43°21′E · Bab el-Mandeb

    The Red Sea empties

    From late 2023, Houthi attacks on merchant ships sent most traffic between Asia and Europe around Africa. Ships through the Suez Canal fell by about half, and the Cape of Good Hope took the overflow. On the globe: the usual Singapore–Rotterdam route in cyan and the detour around the Cape in amber, about 3,500 nautical miles longer.

    Ships a day, monthly · IMF PortWatch
    26°18′N 56°52′E · Strait of Hormuz

    Hormuz goes dark

    About a fifth of the world’s oil left the Persian Gulf through this gap in 2025, some 21 million barrels a day (U.S. EIA). Since US–Israeli strikes on Iran began on 28 February 2026, PortWatch has counted 6.6 ships a day, 92% fewer than in 2025, and oil flows fell to 4.9 million barrels a day in the second quarter.

    Ships a day, monthly · IMF PortWatch (AIS: ships sailing dark are missed)
    9°07′N 79°46′W · Panama Canal

    When the canal ran dry

    The Panama Canal’s locks run on fresh water from Gatun Lake. In the 2023–24 drought the canal had to cut daily transits, and in its 2024 fiscal year transits fell by 29% (Panama Canal Authority). The original locks are only 33.5 m wide; the newer ones, 55 m.

    Ships a day, monthly · IMF PortWatch
    35°57′N 5°45′W · Strait of Gibraltar

    Europe’s gates

    The Dover Strait and the Strait of Gibraltar are among the busiest waterways anywhere. The Bosporus, 700 m wide at its narrowest, runs through the middle of Istanbul and, with the Dardanelles, is the Black Sea’s only way to the oceans.

    Ships a day, 2025 · IMF PortWatch
    Your watch · 41 ports · 11 switches

    Close a strait

    The globe is yours now: drag to turn it. Pick two ports and switch straits off to see where ships must go and how long it takes at 14 knots, a typical cargo-ship speed.

    What if…
    Straits and canals
    2025
    From 33.5 m to 130 km

    The narrows, at one zoom

    Every passage below is drawn at the same scale, with a 400 m container ship on top for size. Drag the zoom: close in, the Panama Canal’s old locks barely fit a Panamax ship; pull back, and the Taiwan Strait still runs off the edge.

     
    IMF PortWatch · 28 chokepoints · 2025

    The manifest

    The Strait of Malacca carried 3.31 billion tonnes of cargo in 2025, the most of any chokepoint; the Taiwan Strait saw the most ships, 239 a day. Since war broke out on 28 February 2026, the Strait of Hormuz has averaged 6.6 ships a day, 92% below 2025. Sort by any column, filter by region, or select a name to see it on the globe.

    28 of 28 chokepoints

    Cargo: IMF PortWatch estimated trade volume carried by container, dry-bulk, general-cargo, ro-ro and tanker vessels, 2025. Ships a day: average daily transits of the same vessels, 2025. vs 2023: change in cargo tonnes. 2026 so far: ships a day from 1 January to 27 September 2026 against 2025. Select a name to fly to it on the globe.
    1Asia3,309234.5+9%−4%2.8 km
    2Asia2,268170.4+6%−4%–
    3Asia2,168238.8+6%−2%~130 km
    4Africa2,07389.5+88%+2%–
    5Asia1,50666.4−7%+19%–
    6Europe1,302174.8+1%−5%33 km
    7Europe1,292135.4−14%−2%14 km
    8Middle East1,17585.5−13%−77%33 km
    9Asia1,147219.4+8%−5%–
    10Asia1,08135.9+11%+4%–
    11Asia1,04746.4−10%+6%–
    12Asia68333.5−30%+35%–
    13Middle East50638.5−59%+6%205 m
    14Asia46431.9+16%+6%–
    15Middle East44033.5−64%+1%29 km
    16Americas42847.9+11%+9%–
    17Europe42392.4+2%−16%700 m
    18Asia37045.7+12%+8%–
    19Americas32631.1+9%+2%33.5 m
    20Asia29410.5+99%−10%–
    21Americas10511.0+16%+4%–
    22Americas10115.7+12%+2%–
    23Asia809.3−28%+12%–
    24Oceania749.5+6%−7%–
    25Americas504.0+2%+10%–
    26Europe4047.1+13%−12%4 km
    27Europe2513.8+353%−39%–
    28Americas7.01.0+94%+1%–
    Questions from the deck

    Logbook

    Basics

    What is a maritime chokepoint?

    A narrow strait or canal on a major shipping route, where a large share of world trade has to pass through a small space. A blockage, an attack or a drought at a chokepoint forces ships onto much longer routes. More than 80% of world goods trade by volume travels by sea (UNCTAD).

    1°31′N 102°40′E

    Which chokepoint carries the most cargo?

    The Strait of Malacca, between Malaysia and the Indonesian island of Sumatra: 3.31 billion tonnes of cargo in 2025, about 234 ships a day, according to IMF PortWatch. The Taiwan Strait saw slightly more ships, about 239 a day, but carried less cargo (2.17 billion tonnes).

    Oil · Persian Gulf

    How much oil goes through the Strait of Hormuz?

    About 21 million barrels a day in 2025, roughly a fifth of the oil the world consumes, according to the U.S. Energy Information Administration (EIA). In the second quarter of 2026, with the strait all but shut by war, the flow was about 4.9 million barrels a day.

    28 Feb 2026

    What happened in the Strait of Hormuz in 2026?

    US–Israeli strikes on Iran began on 28 February 2026, and Iran’s Revolutionary Guard barred shipping. From 1 March to 27 September 2026, PortWatch counted an average of 6.6 cargo ships and tankers a day, 92% fewer than the 2025 average of 85.5. The counts come from ship transponders (AIS), so vessels sailing with them switched off are missed.

    Since late 2023

    Why are ships avoiding the Red Sea?

    Houthi attacks on merchant ships from late 2023 pushed most container lines and many tankers to sail around Africa instead. In 2025 the Suez Canal carried 59% less cargo than in 2023 and Bab el-Mandeb 64% less, while 88% more went around the Cape of Good Hope.

    The Cape route

    How much longer is the route around Africa?

    Between Singapore and Rotterdam, about 3,500 nautical miles (42%) longer: 11,874 nautical miles around the Cape of Good Hope against 8,386 through the Suez Canal on this page’s route model, or roughly 10 more days at 14 knots. From Shanghai the Cape route is 13,917 nautical miles against 10,597. Try other ports at the console.

    33.5 m

    How narrow is the Panama Canal?

    The original lock chambers are 33.5 m (110 ft) wide. A Panamax ship, built to the most the old locks allow, is 32.3 m wide, which leaves about 60 cm on each side. The newer locks, opened in 2016, are 55 m wide.

    Infographic · 2025 cargo

    The world’s key maritime chokepoints

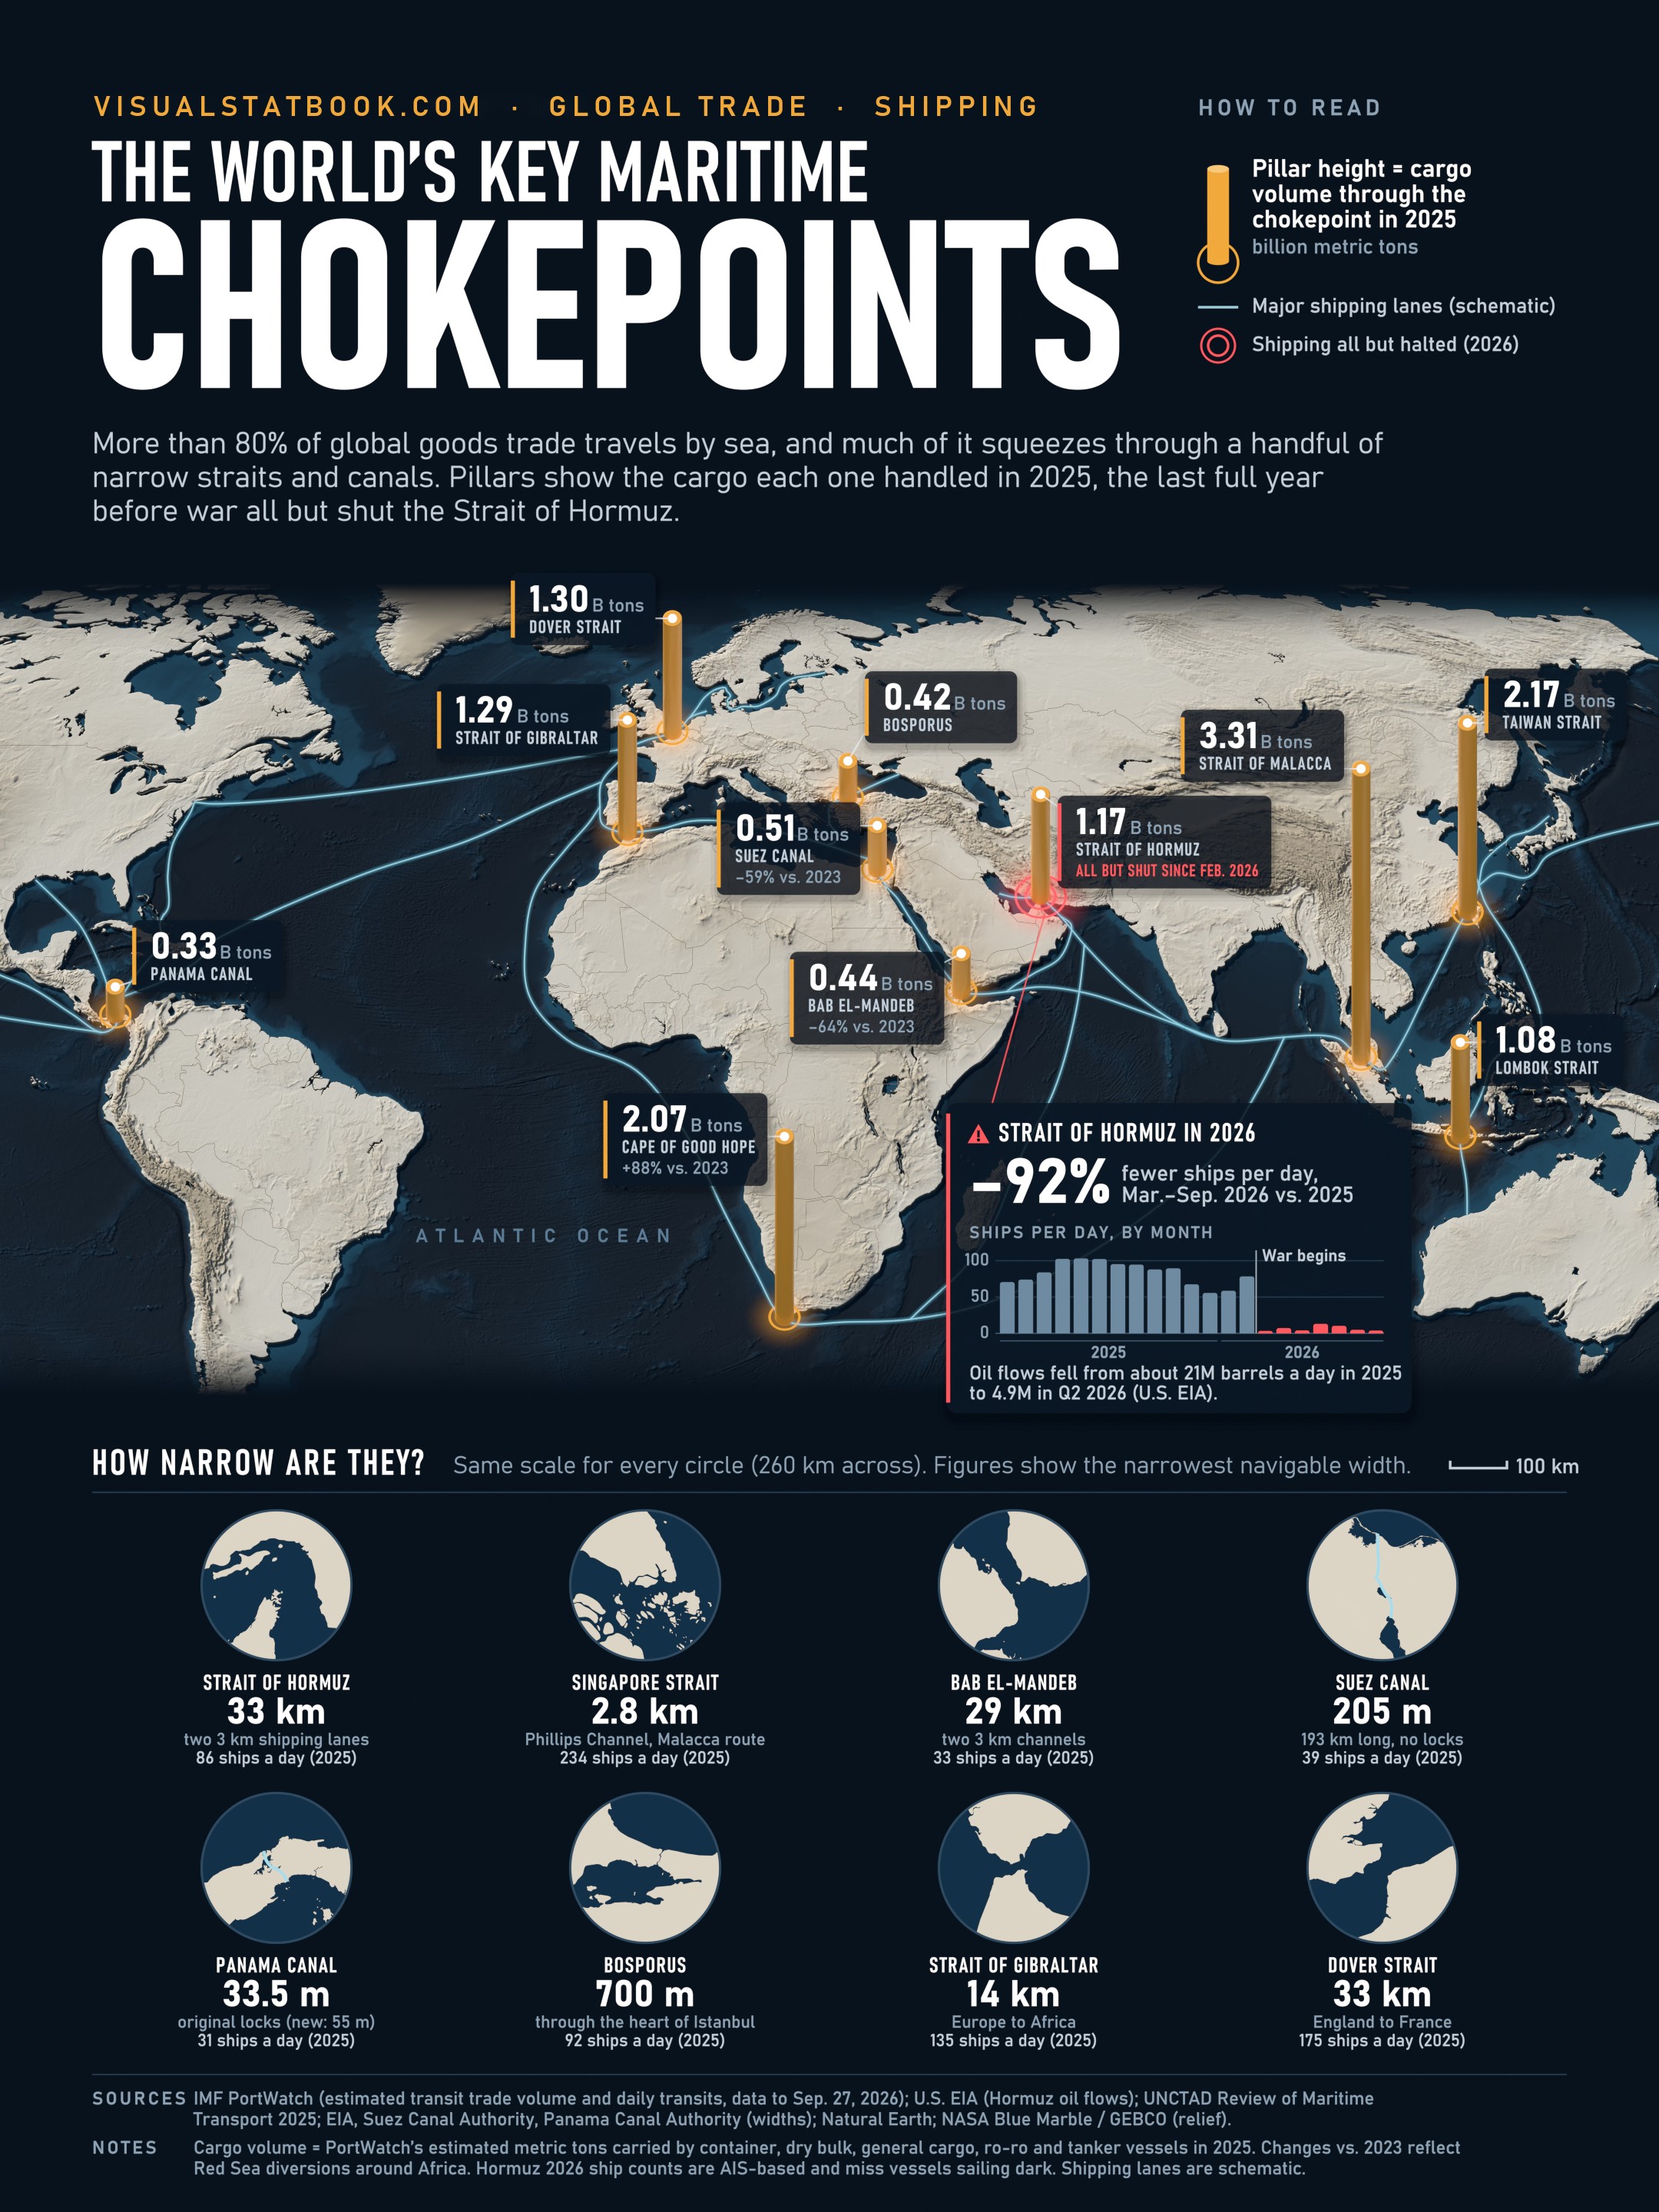
    The poster behind this voyage: eleven straits and canals on a relief world map, each pillar as tall as the cargo that passed through in 2025, the last full year before war all but shut the Strait of Hormuz. Below the map, close-ups of eight straits are drawn at one scale.

    Infographic “The World’s Key Maritime Chokepoints”: amber pillars on a relief world map show the cargo through eleven straits and canals in 2025, led by the Strait of Malacca (3.31 billion tonnes), the Taiwan Strait and the Cape of Good Hope. A callout shows ships through the Strait of Hormuz falling 92% after war began in 2026, and eight circular close-ups compare strait widths from the Panama Canal’s 33.5 m locks to the 33 km Strait of Hormuz.
    Cargo through eleven chokepoints in 2025, IMF PortWatch; Hormuz oil flows, U.S. EIA.
    • 3.31 bn tof cargo through the Strait of Malacca in 2025
    • −92%ships through the Strait of Hormuz, March to September 2026, against 2025
    • +88%cargo around the Cape of Good Hope in 2025 against 2023
    Traffic and cargo: IMF PortWatch daily chokepoint transits (AIS-based), January 2019 to 27 September 2026. Counts cover container, dry-bulk, general-cargo, ro-ro and tanker vessels; cargo is PortWatch’s preliminary estimate of trade volume in metric tonnes. Ships with transponders switched off are missed, which matters for the Strait of Hormuz since March 2026. Oil: U.S. EIA World Oil Transit Chokepoints and Short-Term Energy Outlook. Widths: EIA (Hormuz, Bab el-Mandeb, Singapore Strait), Suez Canal Authority, Panama Canal Authority; Bosporus, Gibraltar, Dover, Øresund and Taiwan Strait are standard reference values. Routes: shortest paths on the Eurostat SeaRoute network (via searoute-py), without the Arctic or the Northwest Passage; real voyages also depend on weather, fuel prices, canal fees and insurance. Maps: Natural Earth; globe relief from NASA Blue Marble / GEBCO. Events: news reports and the 2026 Strait of Hormuz crisis timeline.