


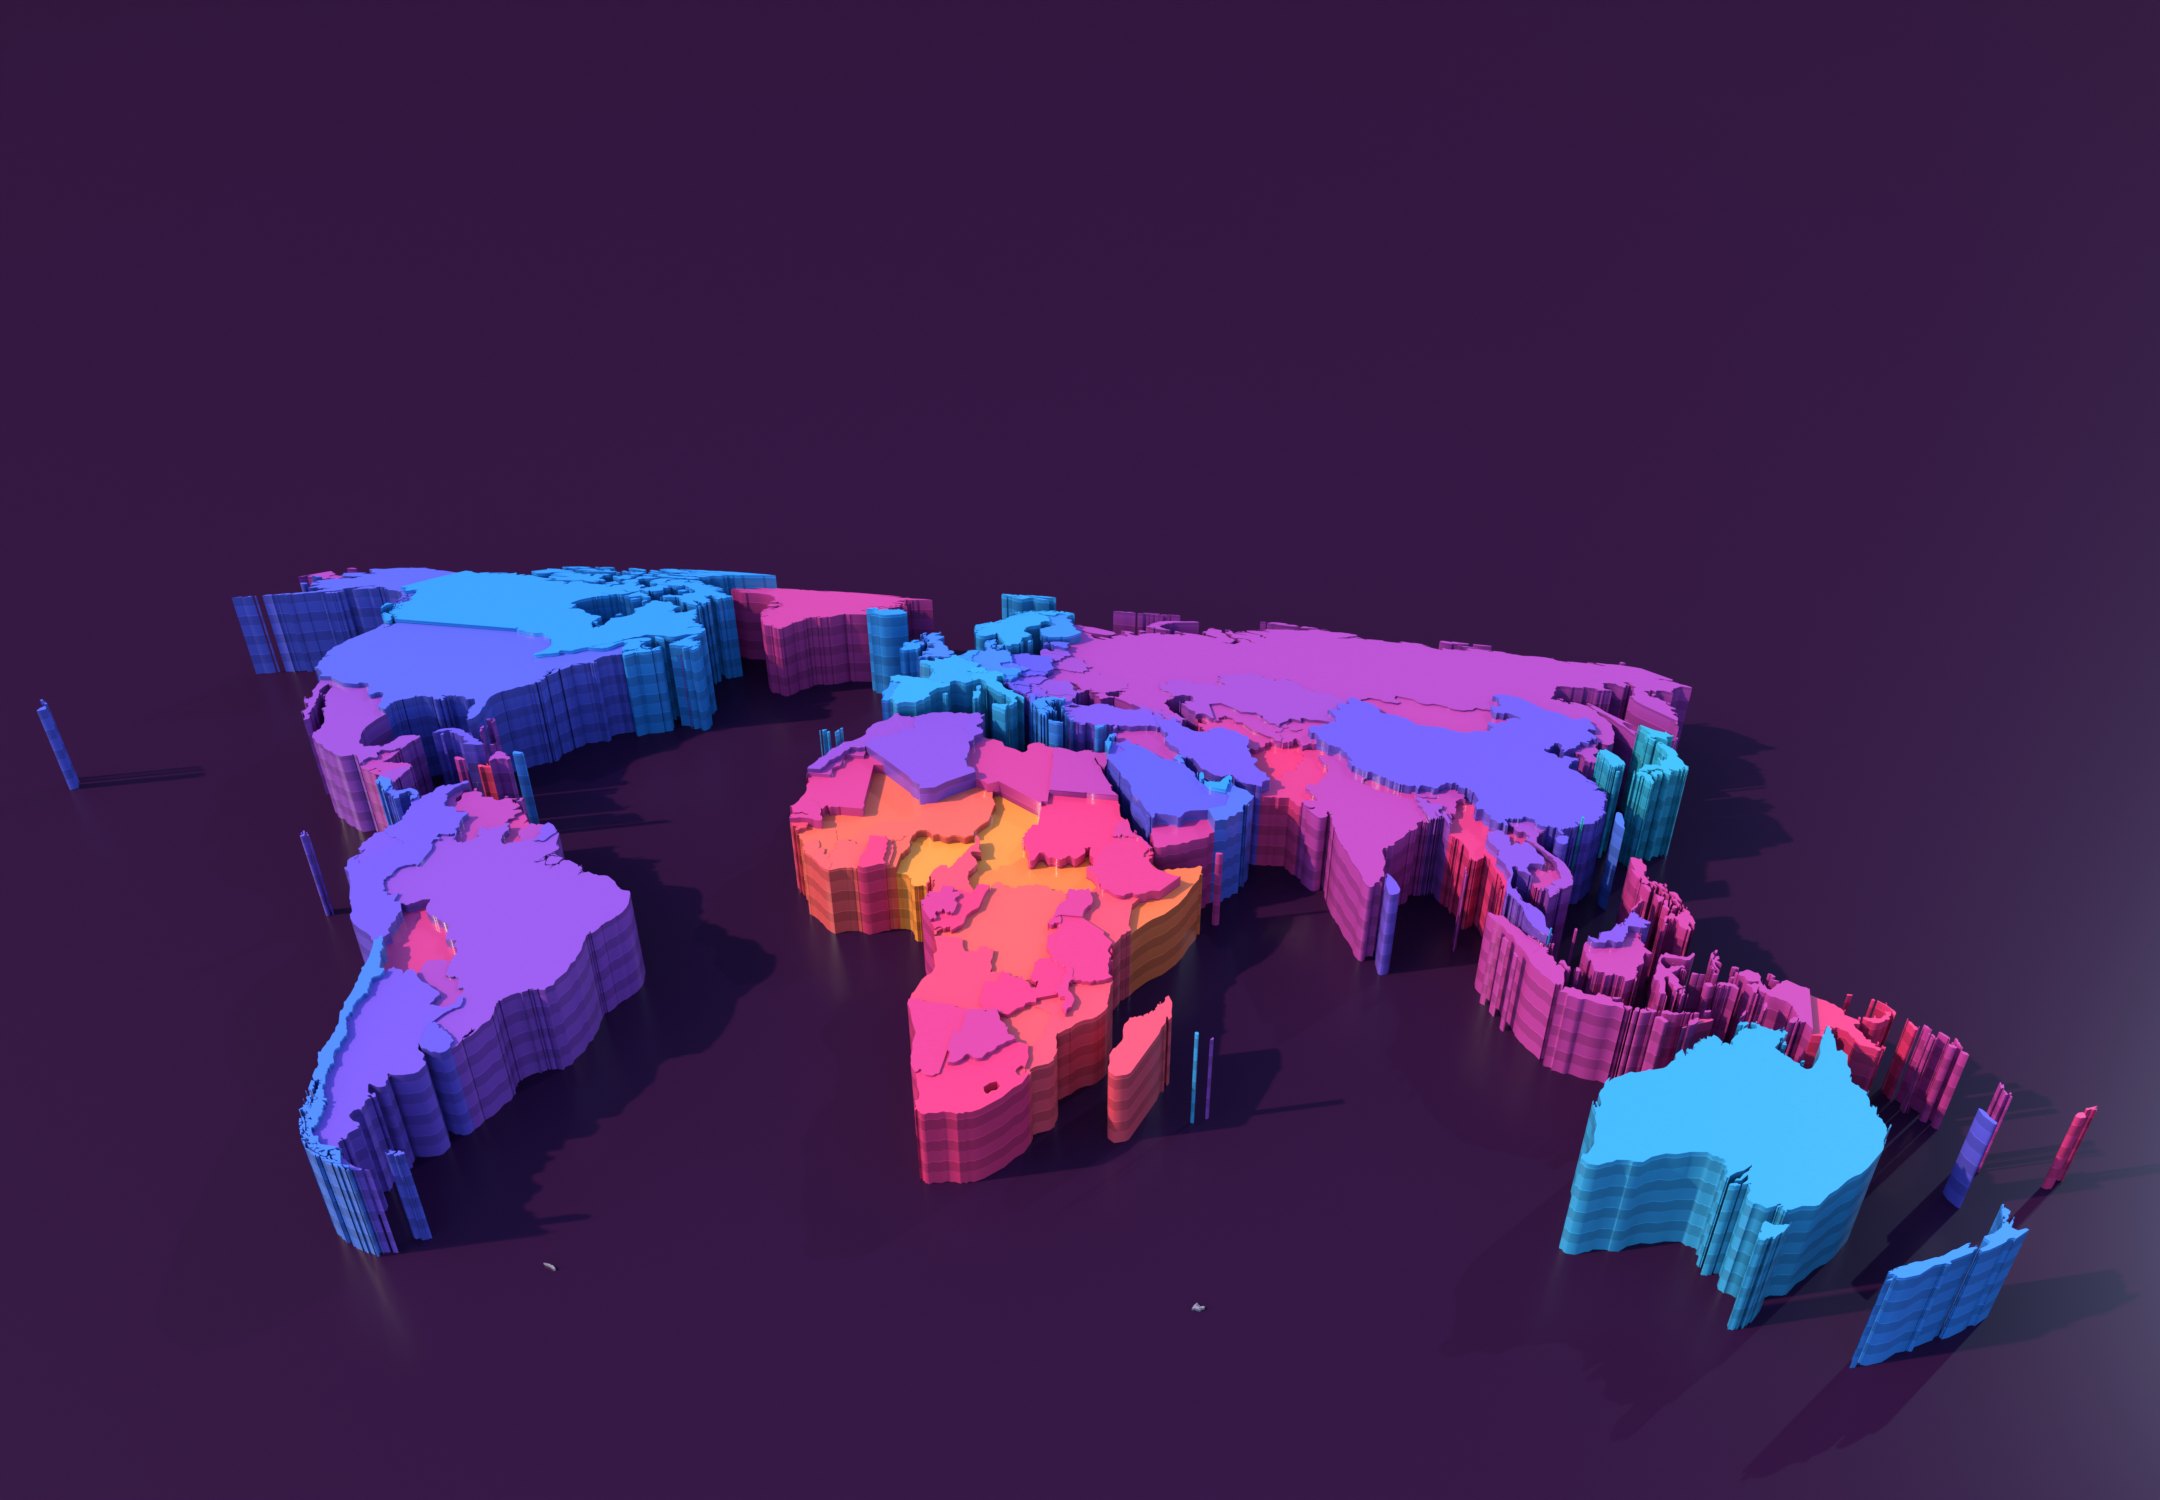
1950 → 2024
Seventy-four years of longer lives
Drag the years or press play: the world gained 27 years of life expectancy since 1950, with dips for famine, war and COVID-19.
Dots: the 195 countries. Small countries are drawn as circles on the map. 2024 is the first year of the UN projection.
Your country vs
How long do people live where you are?
Pick a country and something to measure it against; every faint line is another country since 1950.
Women and men
Women outlive men in every country
Each stem joins men’s and women’s life expectancy in one country; the widest gaps are in Eastern Europe, the narrowest in West Africa.
Tap any country to see its numbers.
The ten longest and the ten shortest
The land, and its years of life
Each country is modelled from its real relief and satellite colour, standing on a slab as thick as its life expectancy: one layer per decade, the same scale for all twenty. Tap one to compare it above.
Slab thickness is the 2023 life expectancy, the same scale on every model (one band = 10 years). Relief sits on top, measured from each country’s lowest ground and exaggerated as marked; scale bars give east–west distance. Satellite colour from 2016; lakes are flat water; tiny islets are left out.
1950 → 2023
The biggest gains
Every country lives longer than in 1950; Oman, the Maldives and the Gulf states added 40 years or more, and the Koreas started from war-year lows.
The poster
Life expectancy on one page
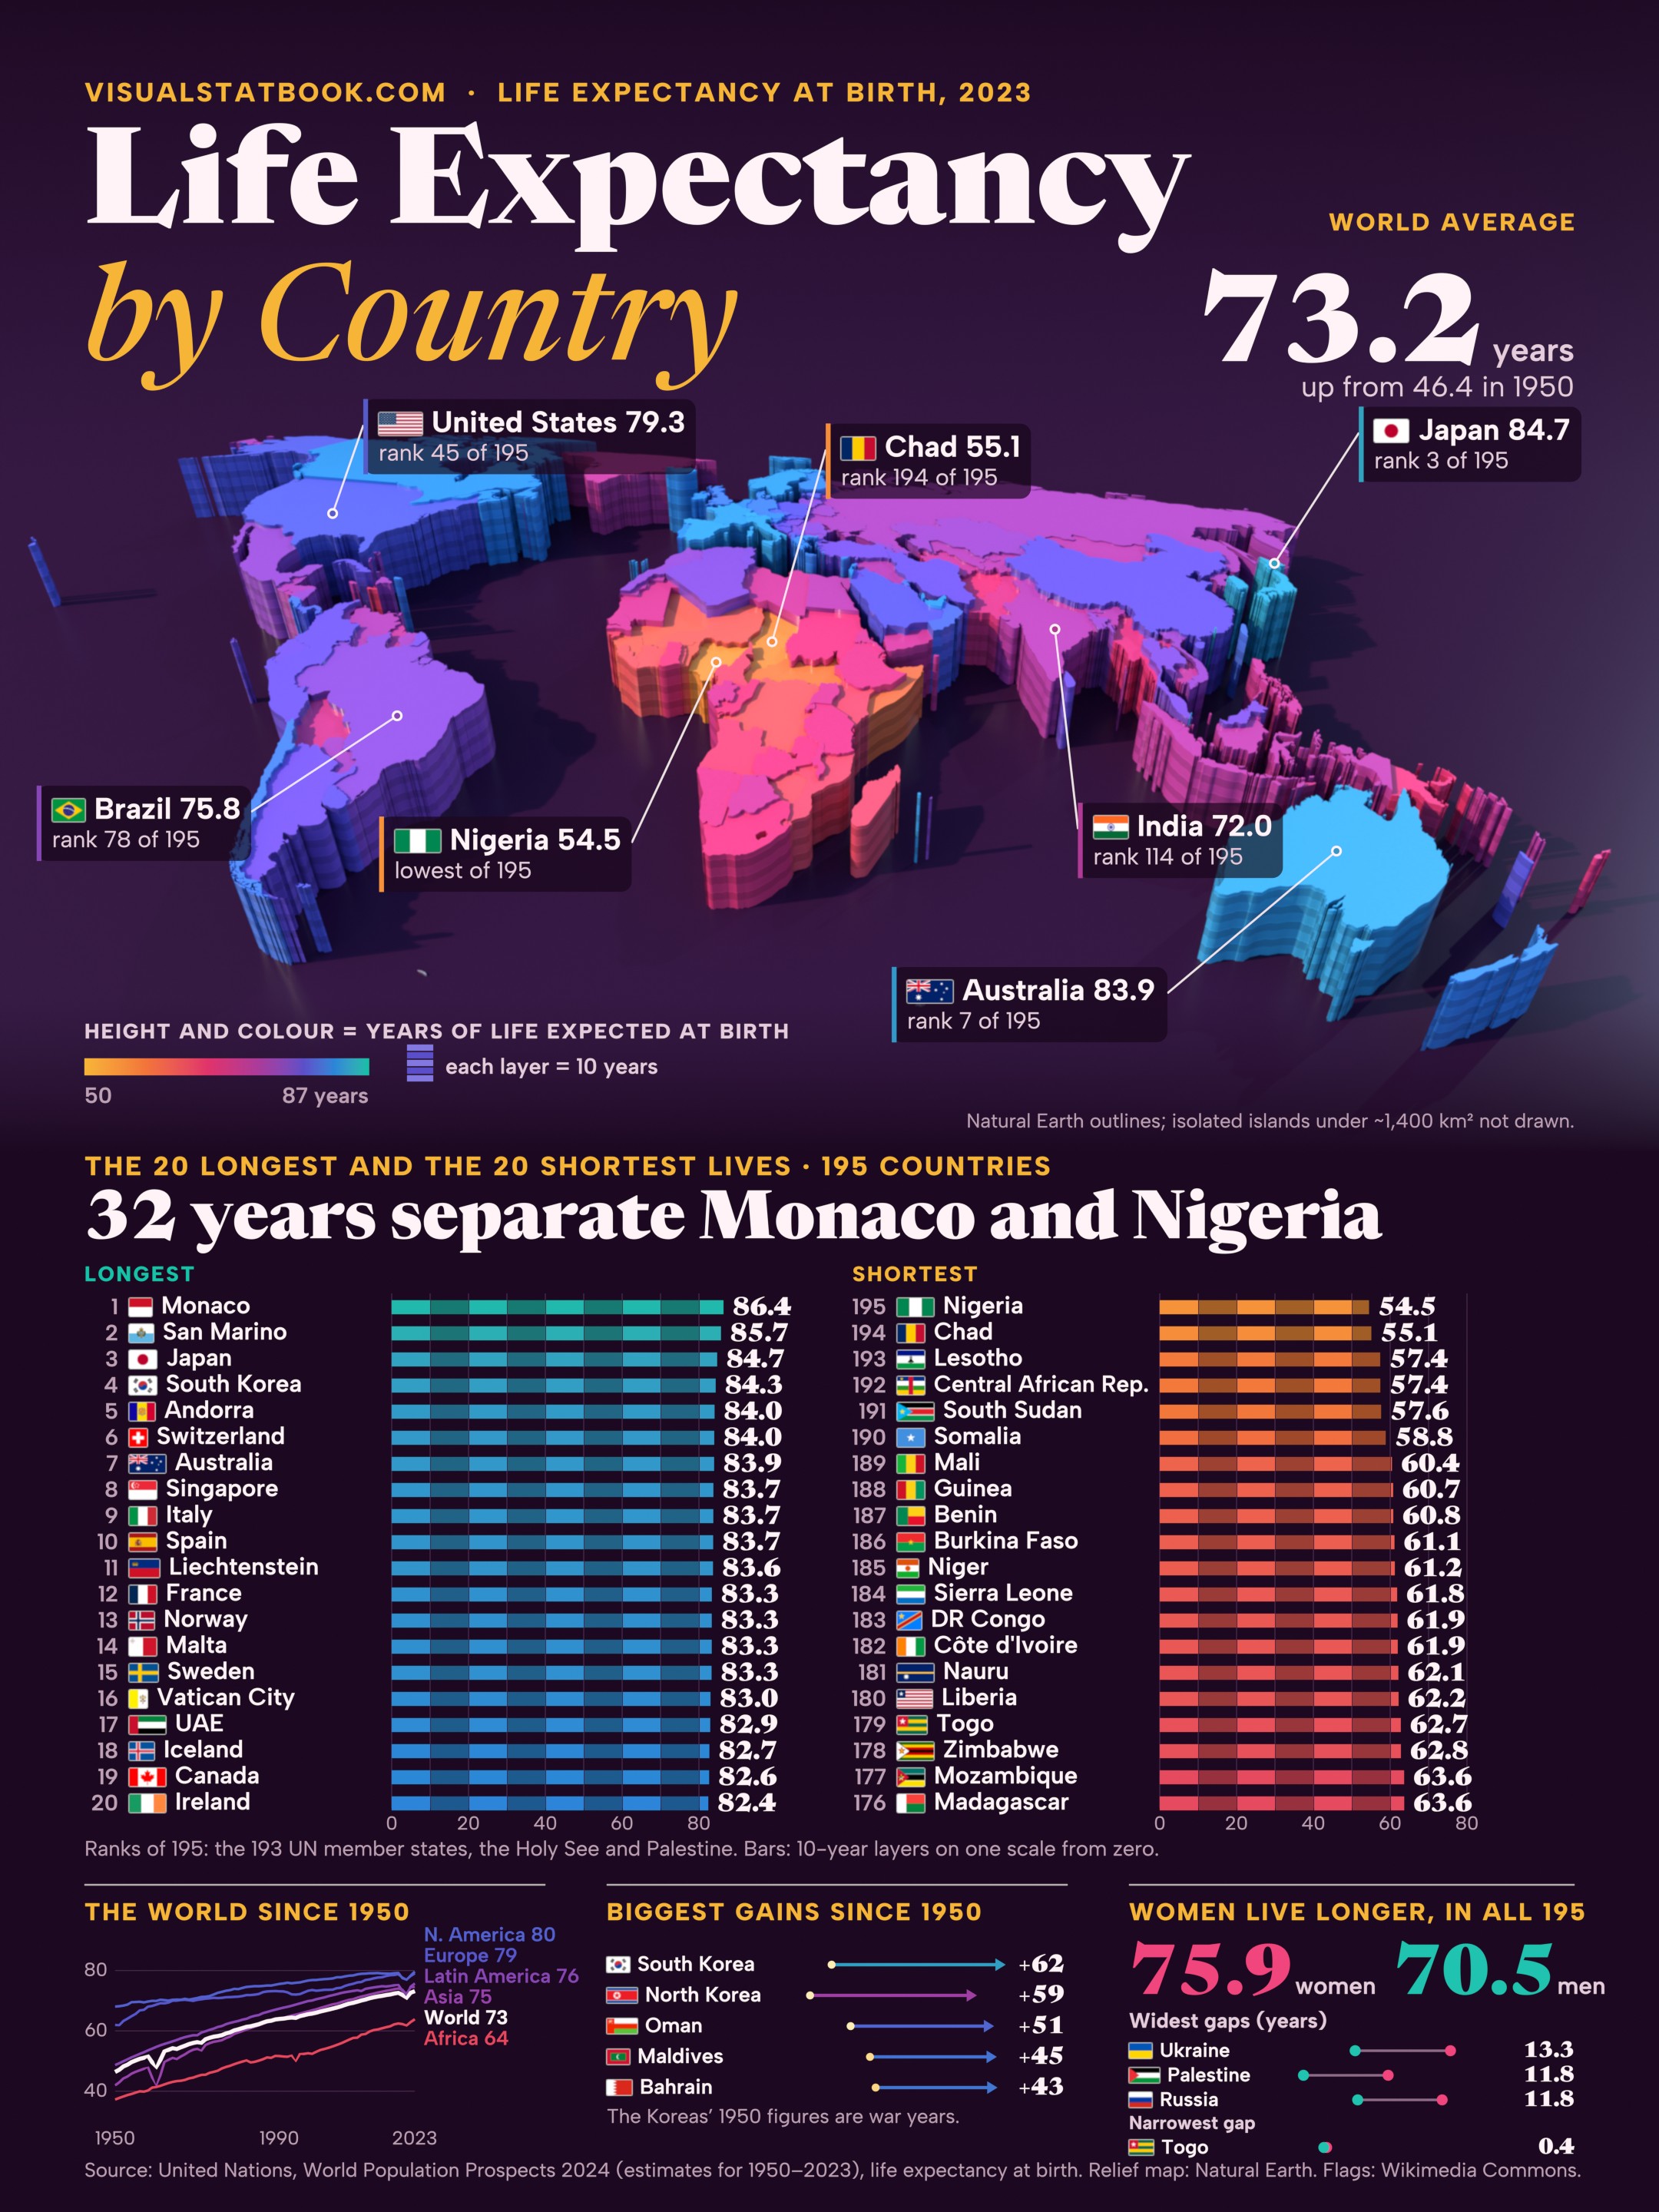
The 3D world, the twenty longest and twenty shortest lives with their flags, the world since 1950, the biggest gains and the gap between women and men.
Open the full-size posterEvery country
The full table
Show the full data table
| Rank | Country or area | Both sexes | Women | Men | Gap | 1950 | Change | Region |
|---|---|---|---|---|---|---|---|---|
| 1 | Monaco | 86.4 | 88.5 | 84.4 | 4.1 | 68.0 | +18.4 | Europe |
| 2 | San Marino | 85.7 | 87.1 | 84.2 | 2.9 | 71.6 | +14.1 | Europe |
| 3 | Japan | 84.7 | 87.7 | 81.7 | 6.0 | 59.3 | +25.5 | Asia |
| 4 | South Korea | 84.3 | 87.2 | 81.2 | 6.0 | 22.2 | +62.1 | Asia |
| 5 | Andorra | 84.0 | 86.1 | 82.1 | 4.0 | 67.2 | +16.9 | Europe |
| 6 | Switzerland | 84.0 | 85.8 | 82.0 | 3.8 | 68.9 | +15.0 | Europe |
| 7 | Australia | 83.9 | 85.7 | 82.1 | 3.6 | 69.0 | +14.9 | Oceania |
| 8 | Singapore | 83.7 | 86.2 | 81.2 | 5.0 | 54.1 | +29.6 | Asia |
| 9 | Italy | 83.7 | 85.7 | 81.6 | 4.2 | 65.7 | +18.0 | Europe |
| 10 | Spain | 83.7 | 86.3 | 81.0 | 5.3 | 61.8 | +21.9 | Europe |
| 11 | Liechtenstein | 83.6 | 85.3 | 81.8 | 3.5 | 65.3 | +18.3 | Europe |
| 12 | France | 83.3 | 86.1 | 80.4 | 5.7 | 66.4 | +16.9 | Europe |
| 13 | Norway | 83.3 | 84.8 | 81.7 | 3.1 | 71.6 | +11.7 | Europe |
| 14 | Malta | 83.3 | 85.3 | 81.3 | 4.0 | 63.5 | +19.8 | Europe |
| 15 | Sweden | 83.3 | 85.1 | 81.4 | 3.7 | 71.1 | +12.1 | Europe |
| 16 | Vatican City | 83.0 | 85.1 | 80.8 | 4.3 | 65.9 | +17.1 | Europe |
| 17 | United Arab Emirates | 82.9 | 84.2 | 82.0 | 2.2 | 42.1 | +40.8 | Asia |
| 18 | Iceland | 82.7 | 84.5 | 81.0 | 3.5 | 71.0 | +11.7 | Europe |
| 19 | Canada | 82.6 | 84.8 | 80.4 | 4.4 | 68.2 | +14.4 | Northern America |
| 20 | Ireland | 82.4 | 84.5 | 80.4 | 4.1 | 65.6 | +16.8 | Europe |
| 21 | Israel | 82.4 | 84.6 | 80.2 | 4.4 | 69.9 | +12.6 | Asia |
| 22 | Qatar | 82.4 | 83.4 | 81.6 | 1.8 | 50.8 | +31.6 | Asia |
| 23 | Portugal | 82.4 | 85.1 | 79.4 | 5.7 | 58.5 | +23.9 | Europe |
| 24 | Luxembourg | 82.2 | 83.8 | 80.6 | 3.3 | 65.5 | +16.7 | Europe |
| 25 | Netherlands | 82.2 | 83.7 | 80.5 | 3.2 | 71.4 | +10.7 | Europe |
| 26 | Belgium | 82.1 | 84.3 | 79.9 | 4.5 | 66.3 | +15.8 | Europe |
| 27 | New Zealand | 82.1 | 83.8 | 80.4 | 3.4 | 69.3 | +12.8 | Oceania |
| 28 | Austria | 82.0 | 84.3 | 79.5 | 4.8 | 64.8 | +17.1 | Europe |
| 29 | Denmark | 81.9 | 83.9 | 80.0 | 3.8 | 70.3 | +11.6 | Europe |
| 30 | Finland | 81.9 | 84.7 | 79.2 | 5.5 | 64.2 | +17.7 | Europe |
| 31 | Greece | 81.9 | 84.3 | 79.3 | 5.0 | 66.2 | +15.6 | Europe |
| 32 | Cyprus | 81.6 | 83.7 | 79.6 | 4.0 | 55.8 | +25.8 | Asia |
| 33 | Slovenia | 81.6 | 84.3 | 78.9 | 5.4 | 61.8 | +19.8 | Europe |
| 34 | Germany | 81.4 | 83.8 | 79.0 | 4.7 | 66.8 | +14.6 | Europe |
| 35 | United Kingdom | 81.3 | 83.2 | 79.4 | 3.9 | 68.6 | +12.7 | Europe |
| 36 | Bahrain | 81.3 | 82.0 | 80.7 | 1.3 | 38.6 | +42.7 | Asia |
| 37 | Chile | 81.2 | 83.1 | 79.2 | 3.8 | 53.2 | +28.0 | Latin America and the Caribbean |
| 38 | Maldives | 81.0 | 82.8 | 79.7 | 3.1 | 36.5 | +44.5 | Asia |
| 39 | Costa Rica | 80.8 | 83.4 | 78.1 | 5.3 | 57.5 | +23.3 | Latin America and the Caribbean |
| 40 | Kuwait | 80.4 | 81.8 | 79.3 | 2.6 | 49.7 | +30.7 | Asia |
| 41 | Oman | 80.0 | 81.9 | 78.5 | 3.4 | 29.3 | +50.7 | Asia |
| 42 | Czechia | 79.8 | 82.6 | 77.0 | 5.6 | 64.4 | +15.4 | Europe |
| 43 | Albania | 79.6 | 81.4 | 77.7 | 3.7 | 44.5 | +35.1 | Europe |
| 44 | Panama | 79.6 | 82.6 | 76.7 | 5.9 | 55.4 | +24.2 | Latin America and the Caribbean |
| 45 | United States | 79.3 | 81.8 | 76.9 | 5.0 | 68.1 | +11.2 | Northern America |
| 46 | Estonia | 79.2 | 83.0 | 74.9 | 8.1 | 66.4 | +12.8 | Europe |
| 47 | Saudi Arabia | 78.7 | 81.2 | 77.1 | 4.1 | 40.0 | +38.7 | Asia |
| 48 | Poland | 78.6 | 82.4 | 74.9 | 7.5 | 58.3 | +20.3 | Europe |
| 49 | Croatia | 78.6 | 81.7 | 75.4 | 6.3 | 58.5 | +20.1 | Europe |
| 50 | Slovakia | 78.3 | 81.6 | 75.0 | 6.6 | 60.8 | +17.6 | Europe |
| 51 | Uruguay | 78.1 | 81.9 | 74.2 | 7.7 | 65.6 | +12.6 | Latin America and the Caribbean |
| 52 | Cuba | 78.1 | 80.5 | 75.7 | 4.8 | 59.0 | +19.1 | Latin America and the Caribbean |
| 53 | China | 78.0 | 80.9 | 75.2 | 5.7 | 43.8 | +34.1 | Asia |
| 54 | Bosnia and Herzegovina | 77.8 | 80.9 | 74.4 | 6.5 | 47.3 | +30.5 | Europe |
| 55 | Lebanon | 77.8 | 79.7 | 75.7 | 4.0 | 59.9 | +17.9 | Asia |
| 56 | Jordan | 77.8 | 80.2 | 75.7 | 4.5 | 40.9 | +36.9 | Asia |
| 57 | Peru | 77.7 | 80.1 | 75.4 | 4.7 | 46.0 | +31.7 | Latin America and the Caribbean |
| 58 | Colombia | 77.7 | 80.5 | 75.0 | 5.5 | 48.3 | +29.4 | Latin America and the Caribbean |
| 59 | Iran | 77.7 | 79.6 | 75.8 | 3.8 | 38.2 | +39.5 | Asia |
| 60 | Antigua and Barbuda | 77.6 | 80.3 | 74.5 | 5.7 | 58.1 | +19.5 | Latin America and the Caribbean |
| 61 | Sri Lanka | 77.5 | 80.6 | 74.2 | 6.3 | 53.2 | +24.3 | Asia |
| 62 | Argentina | 77.4 | 79.9 | 74.8 | 5.1 | 61.3 | +16.1 | Latin America and the Caribbean |
| 63 | North Macedonia | 77.4 | 79.6 | 75.1 | 4.5 | 50.6 | +26.8 | Europe |
| 64 | Ecuador | 77.4 | 80.1 | 74.7 | 5.5 | 48.4 | +28.9 | Latin America and the Caribbean |
| 65 | Türkiye | 77.2 | 79.9 | 74.5 | 5.3 | 47.3 | +29.9 | Asia |
| 66 | Montenegro | 77.1 | 80.3 | 73.7 | 6.6 | 58.0 | +19.1 | Europe |
| 67 | Hungary | 77.0 | 80.2 | 73.7 | 6.5 | 62.1 | +14.9 | Europe |
| 68 | Serbia | 76.8 | 80.0 | 73.5 | 6.5 | 55.1 | +21.7 | Europe |
| 69 | Malaysia | 76.7 | 79.4 | 74.3 | 5.1 | 48.5 | +28.2 | Asia |
| 70 | Tunisia | 76.5 | 79.1 | 73.9 | 5.2 | 38.2 | +38.3 | Africa |
| 71 | Thailand | 76.4 | 80.9 | 72.2 | 8.7 | 45.2 | +31.2 | Asia |
| 72 | Algeria | 76.3 | 77.7 | 74.9 | 2.8 | 42.7 | +33.6 | Africa |
| 73 | Latvia | 76.2 | 80.5 | 71.6 | 8.9 | 64.6 | +11.6 | Europe |
| 74 | Barbados | 76.2 | 78.6 | 73.6 | 5.0 | 53.6 | +22.6 | Latin America and the Caribbean |
| 75 | Cabo Verde | 76.1 | 79.2 | 72.9 | 6.3 | 44.9 | +31.1 | Africa |
| 76 | Lithuania | 76.0 | 80.7 | 71.2 | 9.5 | 66.1 | +10.0 | Europe |
| 77 | Romania | 75.9 | 79.6 | 72.4 | 7.2 | 60.5 | +15.4 | Europe |
| 78 | Brazil | 75.8 | 79.0 | 72.8 | 6.2 | 48.5 | +27.3 | Latin America and the Caribbean |
| 79 | Armenia | 75.7 | 79.5 | 71.4 | 8.1 | 54.6 | +21.1 | Asia |
| 80 | Bulgaria | 75.6 | 79.2 | 72.2 | 7.0 | 61.5 | +14.2 | Europe |
| 81 | Brunei | 75.3 | 77.6 | 73.3 | 4.2 | 50.6 | +24.8 | Asia |
| 82 | Morocco | 75.3 | 77.6 | 73.2 | 4.4 | 38.8 | +36.5 | Africa |
| 83 | Grenada | 75.2 | 78.4 | 72.4 | 6.0 | 52.7 | +22.5 | Latin America and the Caribbean |
| 84 | Mexico | 75.1 | 77.8 | 72.2 | 5.6 | 43.8 | +31.2 | Latin America and the Caribbean |
| 85 | Nicaragua | 74.9 | 77.4 | 72.3 | 5.1 | 40.6 | +34.3 | Latin America and the Caribbean |
| 86 | Mauritius | 74.9 | 78.2 | 71.9 | 6.2 | 51.9 | +23.0 | Africa |
| 87 | Bangladesh | 74.7 | 76.4 | 73.0 | 3.3 | 37.4 | +37.3 | Asia |
| 88 | Vietnam | 74.6 | 79.3 | 69.9 | 9.4 | 48.0 | +26.6 | Asia |
| 89 | Bahamas | 74.6 | 78.2 | 70.9 | 7.3 | 58.9 | +15.7 | Latin America and the Caribbean |
| 90 | Georgia | 74.5 | 79.1 | 69.6 | 9.5 | 57.7 | +16.8 | Asia |
| 91 | Belarus | 74.4 | 79.1 | 69.5 | 9.5 | 58.6 | +15.8 | Europe |
| 92 | Azerbaijan | 74.4 | 77.1 | 71.6 | 5.6 | 46.3 | +28.1 | Asia |
| 93 | Kazakhstan | 74.4 | 78.4 | 70.1 | 8.3 | 55.6 | +18.8 | Asia |
| 94 | Paraguay | 73.8 | 77.0 | 70.9 | 6.1 | 58.1 | +15.8 | Latin America and the Caribbean |
| 95 | Dominican Republic | 73.7 | 77.0 | 70.5 | 6.4 | 44.1 | +29.7 | Latin America and the Caribbean |
| 96 | North Korea | 73.6 | 75.7 | 71.5 | 4.3 | 14.2 | +59.4 | Asia |
| 97 | Suriname | 73.6 | 76.8 | 70.5 | 6.4 | 50.7 | +22.9 | Latin America and the Caribbean |
| 98 | Belize | 73.6 | 76.5 | 70.9 | 5.6 | 49.2 | +24.4 | Latin America and the Caribbean |
| 99 | Trinidad and Tobago | 73.5 | 76.7 | 70.4 | 6.3 | 57.0 | +16.5 | Latin America and the Caribbean |
| 100 | Ukraine | 73.4 | 80.2 | 66.9 | 13.3 | 61.2 | +12.2 | Europe |
| 101 | Russia | 73.2 | 79.0 | 67.3 | 11.8 | 55.5 | +17.7 | Europe |
| 102 | Bhutan | 73.0 | 75.0 | 71.3 | 3.7 | 35.3 | +37.7 | Asia |
| 103 | Tonga | 72.9 | 76.4 | 69.4 | 7.0 | 48.4 | +24.5 | Oceania |
| 104 | Honduras | 72.9 | 75.5 | 70.3 | 5.2 | 41.0 | +31.8 | Latin America and the Caribbean |
| 105 | Seychelles | 72.9 | 76.5 | 69.9 | 6.6 | 57.8 | +15.0 | Africa |
| 106 | St Lucia | 72.7 | 76.3 | 69.3 | 7.0 | 48.3 | +24.4 | Latin America and the Caribbean |
| 107 | Guatemala | 72.6 | 74.9 | 70.3 | 4.6 | 37.8 | +34.8 | Latin America and the Caribbean |
| 108 | Venezuela | 72.5 | 76.5 | 68.7 | 7.8 | 51.1 | +21.4 | Latin America and the Caribbean |
| 109 | Uzbekistan | 72.4 | 75.4 | 69.5 | 6.0 | 53.3 | +19.1 | Asia |
| 110 | Iraq | 72.3 | 74.1 | 70.4 | 3.6 | 37.4 | +34.9 | Asia |
| 111 | St Kitts and Nevis | 72.1 | 76.0 | 68.6 | 7.5 | 54.8 | +17.4 | Latin America and the Caribbean |
| 112 | Syria | 72.1 | 74.4 | 69.8 | 4.6 | 42.5 | +29.7 | Asia |
| 113 | El Salvador | 72.1 | 76.3 | 67.5 | 8.7 | 44.2 | +27.9 | Latin America and the Caribbean |
| 114 | India | 72.0 | 73.6 | 70.5 | 3.1 | 41.2 | +30.8 | Asia |
| 115 | Tajikistan | 71.8 | 74.0 | 69.6 | 4.4 | 49.3 | +22.4 | Asia |
| 116 | Mongolia | 71.7 | 76.4 | 67.2 | 9.2 | 38.6 | +33.1 | Asia |
| 117 | Samoa | 71.7 | 73.7 | 69.9 | 3.8 | 49.2 | +22.5 | Oceania |
| 118 | Kyrgyzstan | 71.7 | 75.2 | 68.2 | 7.1 | 52.1 | +19.6 | Asia |
| 119 | Egypt | 71.6 | 73.8 | 69.5 | 4.3 | 34.0 | +37.7 | Africa |
| 120 | Jamaica | 71.5 | 74.0 | 69.0 | 5.0 | 56.6 | +14.9 | Latin America and the Caribbean |
| 121 | Vanuatu | 71.5 | 73.9 | 69.4 | 4.5 | 43.9 | +27.6 | Oceania |
| 122 | St Vincent and the Grenadines | 71.2 | 74.3 | 68.7 | 5.7 | 46.9 | +24.3 | Latin America and the Caribbean |
| 123 | Moldova | 71.2 | 75.5 | 66.6 | 9.0 | 54.0 | +17.2 | Europe |
| 124 | Indonesia | 71.1 | 73.3 | 69.0 | 4.2 | 40.2 | +30.9 | Asia |
| 125 | Dominica | 71.1 | 74.5 | 68.2 | 6.3 | 44.5 | +26.6 | Latin America and the Caribbean |
| 126 | Cambodia | 70.7 | 73.2 | 68.0 | 5.2 | 38.9 | +31.8 | Asia |
| 127 | Solomon Islands | 70.5 | 72.0 | 69.2 | 2.8 | 41.4 | +29.1 | Oceania |
| 128 | Nepal | 70.4 | 71.8 | 68.8 | 3.0 | 37.6 | +32.8 | Asia |
| 129 | Guyana | 70.2 | 73.9 | 66.5 | 7.4 | 49.2 | +21.0 | Latin America and the Caribbean |
| 130 | Turkmenistan | 70.1 | 72.8 | 66.9 | 6.0 | 48.1 | +22.0 | Asia |
| 131 | Philippines | 69.8 | 72.8 | 66.9 | 5.9 | 53.6 | +16.2 | Asia |
| 132 | São Tomé and Príncipe | 69.7 | 73.7 | 66.2 | 7.5 | 39.1 | +30.6 | Africa |
| 133 | Libya | 69.3 | 70.4 | 68.3 | 2.1 | 33.1 | +36.2 | Africa |
| 134 | Yemen | 69.3 | 71.4 | 67.2 | 4.2 | 28.9 | +40.4 | Asia |
| 135 | Palau | 69.3 | 71.8 | 67.2 | 4.6 | 52.7 | +16.6 | Oceania |
| 136 | Botswana | 69.2 | 71.7 | 66.7 | 5.0 | 46.2 | +23.0 | Africa |
| 137 | Laos | 69.0 | 71.2 | 66.8 | 4.5 | 38.9 | +30.0 | Asia |
| 138 | Senegal | 68.7 | 70.8 | 66.8 | 4.0 | 36.5 | +32.2 | Africa |
| 139 | Eritrea | 68.6 | 70.7 | 66.5 | 4.2 | 33.3 | +35.3 | Africa |
| 140 | Bolivia | 68.6 | 71.1 | 66.1 | 5.0 | 40.7 | +27.9 | Latin America and the Caribbean |
| 141 | Mauritania | 68.5 | 70.5 | 66.5 | 4.0 | 38.4 | +30.1 | Africa |
| 142 | Gabon | 68.3 | 71.1 | 65.9 | 5.2 | 39.3 | +29.1 | Africa |
| 143 | Uganda | 68.3 | 71.1 | 65.3 | 5.8 | 39.7 | +28.5 | Africa |
| 144 | Rwanda | 67.8 | 69.9 | 65.5 | 4.4 | 43.2 | +24.6 | Africa |
| 145 | Timor-Leste | 67.7 | 69.4 | 66.1 | 3.4 | 29.2 | +38.5 | Asia |
| 146 | Pakistan | 67.6 | 70.2 | 65.3 | 4.8 | 34.2 | +33.4 | Asia |
| 147 | Namibia | 67.4 | 71.3 | 63.3 | 8.0 | 41.9 | +25.4 | Africa |
| 148 | Malawi | 67.4 | 70.6 | 64.1 | 6.5 | 32.7 | +34.7 | Africa |
| 149 | Fiji | 67.3 | 69.4 | 65.3 | 4.0 | 51.7 | +15.6 | Oceania |
| 150 | Ethiopia | 67.3 | 70.7 | 64.1 | 6.7 | 35.5 | +31.8 | Africa |
| 151 | Micronesia | 67.2 | 71.1 | 63.5 | 7.6 | 48.4 | +18.8 | Oceania |
| 152 | Tuvalu | 67.1 | 70.7 | 63.8 | 6.9 | 40.0 | +27.1 | Oceania |
| 153 | Tanzania | 67.0 | 69.8 | 64.2 | 5.6 | 41.0 | +26.0 | Africa |
| 154 | Marshall Islands | 66.9 | 69.3 | 64.9 | 4.4 | 52.6 | +14.3 | Oceania |
| 155 | Myanmar | 66.9 | 70.2 | 63.8 | 6.4 | 35.7 | +31.2 | Asia |
| 156 | Comoros | 66.8 | 68.9 | 64.8 | 4.2 | 37.4 | +29.4 | Africa |
| 157 | Kiribati | 66.5 | 68.2 | 64.6 | 3.6 | 45.7 | +20.8 | Oceania |
| 158 | Zambia | 66.3 | 68.7 | 63.9 | 4.7 | 46.8 | +19.6 | Africa |
| 159 | Sudan | 66.3 | 69.6 | 63.3 | 6.3 | 45.8 | +20.5 | Africa |
| 160 | South Africa | 66.1 | 69.6 | 62.6 | 7.0 | 43.1 | +23.0 | Africa |
| 161 | Papua New Guinea | 66.1 | 69.1 | 63.7 | 5.3 | 39.4 | +26.8 | Oceania |
| 162 | Afghanistan | 66.0 | 67.5 | 64.5 | 3.1 | 28.2 | +37.9 | Asia |
| 163 | Djibouti | 66.0 | 68.5 | 63.5 | 5.0 | 40.7 | +25.3 | Africa |
| 164 | Gambia | 65.9 | 67.5 | 64.2 | 3.4 | 31.2 | +34.7 | Africa |
| 165 | Congo | 65.8 | 67.5 | 64.1 | 3.3 | 39.6 | +26.2 | Africa |
| 166 | Ghana | 65.5 | 67.9 | 63.1 | 4.8 | 43.1 | +22.4 | Africa |
| 167 | Palestine | 65.2 | 71.5 | 59.7 | 11.8 | 45.7 | +19.4 | Asia |
| 168 | Haiti | 64.9 | 68.3 | 61.7 | 6.6 | 37.2 | +27.7 | Latin America and the Caribbean |
| 169 | Angola | 64.6 | 67.1 | 62.1 | 5.0 | 35.9 | +28.8 | Africa |
| 170 | Eswatini | 64.1 | 67.0 | 61.2 | 5.8 | 43.4 | +20.7 | Africa |
| 171 | Guinea-Bissau | 64.1 | 66.4 | 61.7 | 4.7 | 35.7 | +28.4 | Africa |
| 172 | Equatorial Guinea | 63.7 | 65.7 | 62.0 | 3.6 | 40.1 | +23.6 | Africa |
| 173 | Cameroon | 63.7 | 65.9 | 61.5 | 4.4 | 33.1 | +30.6 | Africa |
| 174 | Burundi | 63.7 | 65.7 | 61.6 | 4.1 | 40.9 | +22.7 | Africa |
| 175 | Kenya | 63.6 | 65.9 | 61.5 | 4.5 | 36.9 | +26.8 | Africa |
| 176 | Madagascar | 63.6 | 65.4 | 61.9 | 3.4 | 39.7 | +24.0 | Africa |
| 177 | Mozambique | 63.6 | 66.5 | 60.3 | 6.2 | 37.3 | +26.3 | Africa |
| 178 | Zimbabwe | 62.8 | 65.0 | 60.2 | 4.8 | 49.4 | +13.4 | Africa |
| 179 | Togo | 62.7 | 62.9 | 62.5 | 0.4 | 41.9 | +20.8 | Africa |
| 180 | Liberia | 62.2 | 63.4 | 60.9 | 2.6 | 38.0 | +24.2 | Africa |
| 181 | Nauru | 62.1 | 64.0 | 60.3 | 3.7 | 56.6 | +5.5 | Oceania |
| 182 | Côte d'Ivoire | 61.9 | 64.1 | 60.0 | 4.1 | 30.8 | +31.1 | Africa |
| 183 | DR Congo | 61.9 | 64.0 | 59.8 | 4.2 | 38.2 | +23.7 | Africa |
| 184 | Sierra Leone | 61.8 | 63.5 | 60.1 | 3.4 | 28.9 | +32.9 | Africa |
| 185 | Niger | 61.2 | 62.1 | 60.3 | 1.9 | 35.9 | +25.3 | Africa |
| 186 | Burkina Faso | 61.1 | 63.2 | 58.9 | 4.3 | 33.0 | +28.1 | Africa |
| 187 | Benin | 60.8 | 62.2 | 59.3 | 2.9 | 35.4 | +25.4 | Africa |
| 188 | Guinea | 60.7 | 61.9 | 59.5 | 2.4 | 35.6 | +25.1 | Africa |
| 189 | Mali | 60.4 | 61.9 | 59.0 | 2.9 | 28.7 | +31.7 | Africa |
| 190 | Somalia | 58.8 | 61.4 | 56.4 | 5.0 | 41.5 | +17.4 | Africa |
| 191 | South Sudan | 57.6 | 60.6 | 54.6 | 6.0 | 30.2 | +27.4 | Africa |
| 192 | Central African Republic | 57.4 | 59.3 | 55.3 | 4.0 | 35.4 | +22.0 | Africa |
| 193 | Lesotho | 57.4 | 60.0 | 54.6 | 5.4 | 44.6 | +12.8 | Africa |
| 194 | Chad | 55.1 | 57.0 | 53.2 | 3.8 | 35.2 | +19.8 | Africa |
| 195 | Nigeria | 54.5 | 54.7 | 54.2 | 0.6 | 35.5 | +18.9 | Africa |
| – | Hong Kong (territory) | 85.5 | 88.1 | 82.8 | 5.3 | 57.8 | +27.7 | Asia |
| – | St Barthélemy (territory) | 84.3 | 86.8 | 81.5 | 5.3 | 54.0 | +30.3 | Latin America and the Caribbean |
| – | French Polynesia (territory) | 84.1 | 86.5 | 81.8 | 4.7 | 51.9 | +32.2 | Oceania |
| – | Gibraltar (territory) | 83.6 | 86.1 | 80.9 | 5.2 | 65.1 | +18.4 | Europe |
| – | Réunion (territory) | 83.5 | 86.3 | 80.5 | 5.8 | 47.6 | +36.0 | Africa |
| – | Guernsey (territory) | 83.3 | 85.6 | 81.0 | 4.6 | 71.2 | +12.0 | Europe |
| – | Macao (territory) | 83.1 | 85.2 | 80.8 | 4.4 | 58.3 | +24.7 | Asia |
| – | Martinique (territory) | 82.6 | 85.6 | 79.3 | 6.4 | 55.0 | +27.6 | Latin America and the Caribbean |
| – | Bermuda (territory) | 82.3 | 85.7 | 78.9 | 6.9 | 60.4 | +21.9 | Northern America |
| – | Guadeloupe (territory) | 82.0 | 85.5 | 78.1 | 7.4 | 53.1 | +28.9 | Latin America and the Caribbean |
| – | Puerto Rico (territory) | 81.7 | 85.2 | 78.0 | 7.2 | 60.4 | +21.3 | Latin America and the Caribbean |
| – | Isle of Man (territory) | 81.0 | 83.1 | 78.9 | 4.2 | 63.1 | +17.9 | Europe |
| – | Taiwan (territory) | 80.6 | 83.6 | 77.6 | 6.0 | 56.6 | +24.0 | Asia |
| – | Cayman Islands (territory) | 80.4 | 82.9 | 78.0 | 4.9 | 54.0 | +26.4 | Latin America and the Caribbean |
| – | Saint Martin (French) (territory) | 80.2 | 83.8 | 76.8 | 7.1 | 65.1 | +15.1 | Latin America and the Caribbean |
| – | Faroe Islands (territory) | 80.2 | 82.5 | 78.2 | 4.3 | 60.6 | +19.6 | Europe |
| – | Jersey (territory) | 79.7 | 81.8 | 77.7 | 4.0 | 69.4 | +10.3 | Europe |
| – | Anguilla (territory) | 79.3 | 82.7 | 76.0 | 6.6 | 55.1 | +24.3 | Latin America and the Caribbean |
| – | Falkland Islands (territory) | 79.2 | 81.2 | 77.2 | 4.1 | 49.5 | +29.7 | Latin America and the Caribbean |
| – | Northern Mariana Islands (territory) | 78.8 | 80.7 | 77.1 | 3.6 | 58.2 | +20.6 | Oceania |
| – | New Caledonia (territory) | 78.8 | 81.3 | 76.3 | 5.0 | 45.1 | +33.7 | Oceania |
| – | Wallis and Futuna (territory) | 78.6 | 79.6 | 77.7 | 1.9 | 44.1 | +34.5 | Oceania |
| – | Kosovo (territory) | 78.0 | 80.1 | 75.8 | 4.3 | 43.5 | +34.5 | Europe |
| – | Turks and Caicos Islands (territory) | 78.0 | 80.3 | 75.8 | 4.5 | 48.6 | +29.4 | Latin America and the Caribbean |
| – | Caribbean Netherlands (territory) | 77.4 | 80.2 | 75.2 | 4.9 | 61.5 | +15.9 | Latin America and the Caribbean |
| – | British Virgin Islands (territory) | 77.3 | 80.0 | 74.5 | 5.5 | 53.3 | +23.9 | Latin America and the Caribbean |
| – | Guam (territory) | 77.2 | 81.4 | 73.4 | 8.0 | 59.6 | +17.6 | Oceania |
| – | Tokelau (territory) | 77.1 | 78.9 | 75.0 | 4.0 | 54.7 | +22.4 | Oceania |
| – | French Guiana (territory) | 77.0 | 80.0 | 74.1 | 5.9 | 47.7 | +29.2 | Latin America and the Caribbean |
| – | Curaçao (territory) | 76.8 | 80.8 | 72.5 | 8.4 | 60.3 | +16.5 | Latin America and the Caribbean |
| – | St Helena (territory) | 76.8 | 80.6 | 73.9 | 6.8 | 66.0 | +10.8 | Africa |
| – | St Pierre and Miquelon (territory) | 76.8 | 81.5 | 72.8 | 8.8 | 62.9 | +13.8 | Northern America |
| – | Sint Maarten (territory) | 76.4 | 79.5 | 73.7 | 5.8 | 62.4 | +13.9 | Latin America and the Caribbean |
| – | Aruba (territory) | 76.4 | 78.8 | 73.7 | 5.1 | 58.0 | +18.4 | Latin America and the Caribbean |
| – | Montserrat (territory) | 76.2 | 78.8 | 74.1 | 4.7 | 48.6 | +27.6 | Latin America and the Caribbean |
| – | Mayotte (territory) | 76.1 | 78.3 | 74.1 | 4.2 | 42.2 | +33.8 | Africa |
| – | US Virgin Islands (territory) | 75.5 | 81.4 | 70.5 | 10.8 | 59.9 | +15.6 | Latin America and the Caribbean |
| – | Cook Islands (territory) | 75.3 | 79.0 | 71.9 | 7.2 | 38.0 | +37.3 | Oceania |
| – | American Samoa (territory) | 72.9 | 75.8 | 70.2 | 5.6 | 59.2 | +13.7 | Oceania |
| – | Western Sahara (territory) | 71.4 | 73.5 | 69.7 | 3.9 | 34.9 | +36.5 | Africa |
| – | Greenland (territory) | 70.1 | 72.4 | 68.1 | 4.3 | 39.5 | +30.6 | Northern America |
| – | Niue (territory) | 70.0 | 72.7 | 67.4 | 5.3 | 54.6 | +15.4 | Oceania |
Questions
Life expectancy, answered
Which country has the highest life expectancy?
Monaco, at 86.4 years in 2023 (UN estimate), followed by San Marino (85.7) and Japan (84.7). Hong Kong (85.5) would rank third but is a territory, not a country.
Which country has the lowest life expectancy?
Nigeria, at 54.5 years, then Chad (55.1), Lesotho (57.4) and the Central African Republic (57.4). The gap between the top and bottom is 31.9 years.
What is the world average life expectancy?
73.2 years in 2023: 75.9 for women and 70.5 for men. It was 46.4 in 1950, dipped to 70.9 in 2021 during COVID-19, and the UN projects 73.3 for 2024.
What does life expectancy at birth mean?
The average number of years a newborn would live if that year’s death rates at every age stayed the same for life. It is a snapshot of current mortality, not a prediction, and deaths in childhood pull it down strongly.
Why do women live longer than men?
Women outlive men in all 195 countries, by 5.3 years worldwide. The gap is widest in Ukraine (13.3 years) and Russia (11.8), where alcohol, smoking, violence and war take a heavier toll on men, and narrowest in Togo (0.4) and Nigeria (0.6).
Which countries gained the most since 1950?
South Korea (+62.1 years, from a war-year low of 22.2), North Korea, Oman (+50.7) and the Maldives (+44.5). Every country lives longer today than in 1950.