


The top 20 in 2026
Two rankings: dollars or purchasing power
Nominal GDP converts each economy at market exchange rates; GDP at purchasing-power parity (PPP) adjusts for what money buys at home. Switch the measure and watch the order change.
World GDP, 2026
Every economy as a share of the whole
Each tile’s area is one economy’s GDP; the five colours are the UN regions.
1980 → 2031
The race: how the top 12 changed
Japan was the world’s number two for three decades until China passed it in 2010; on the IMF’s projections India climbs to third by 2031.
Current prices, so dollar values also reflect inflation and exchange rates. Russia and other post-Soviet states appear from 1992.
The 15 largest, modelled
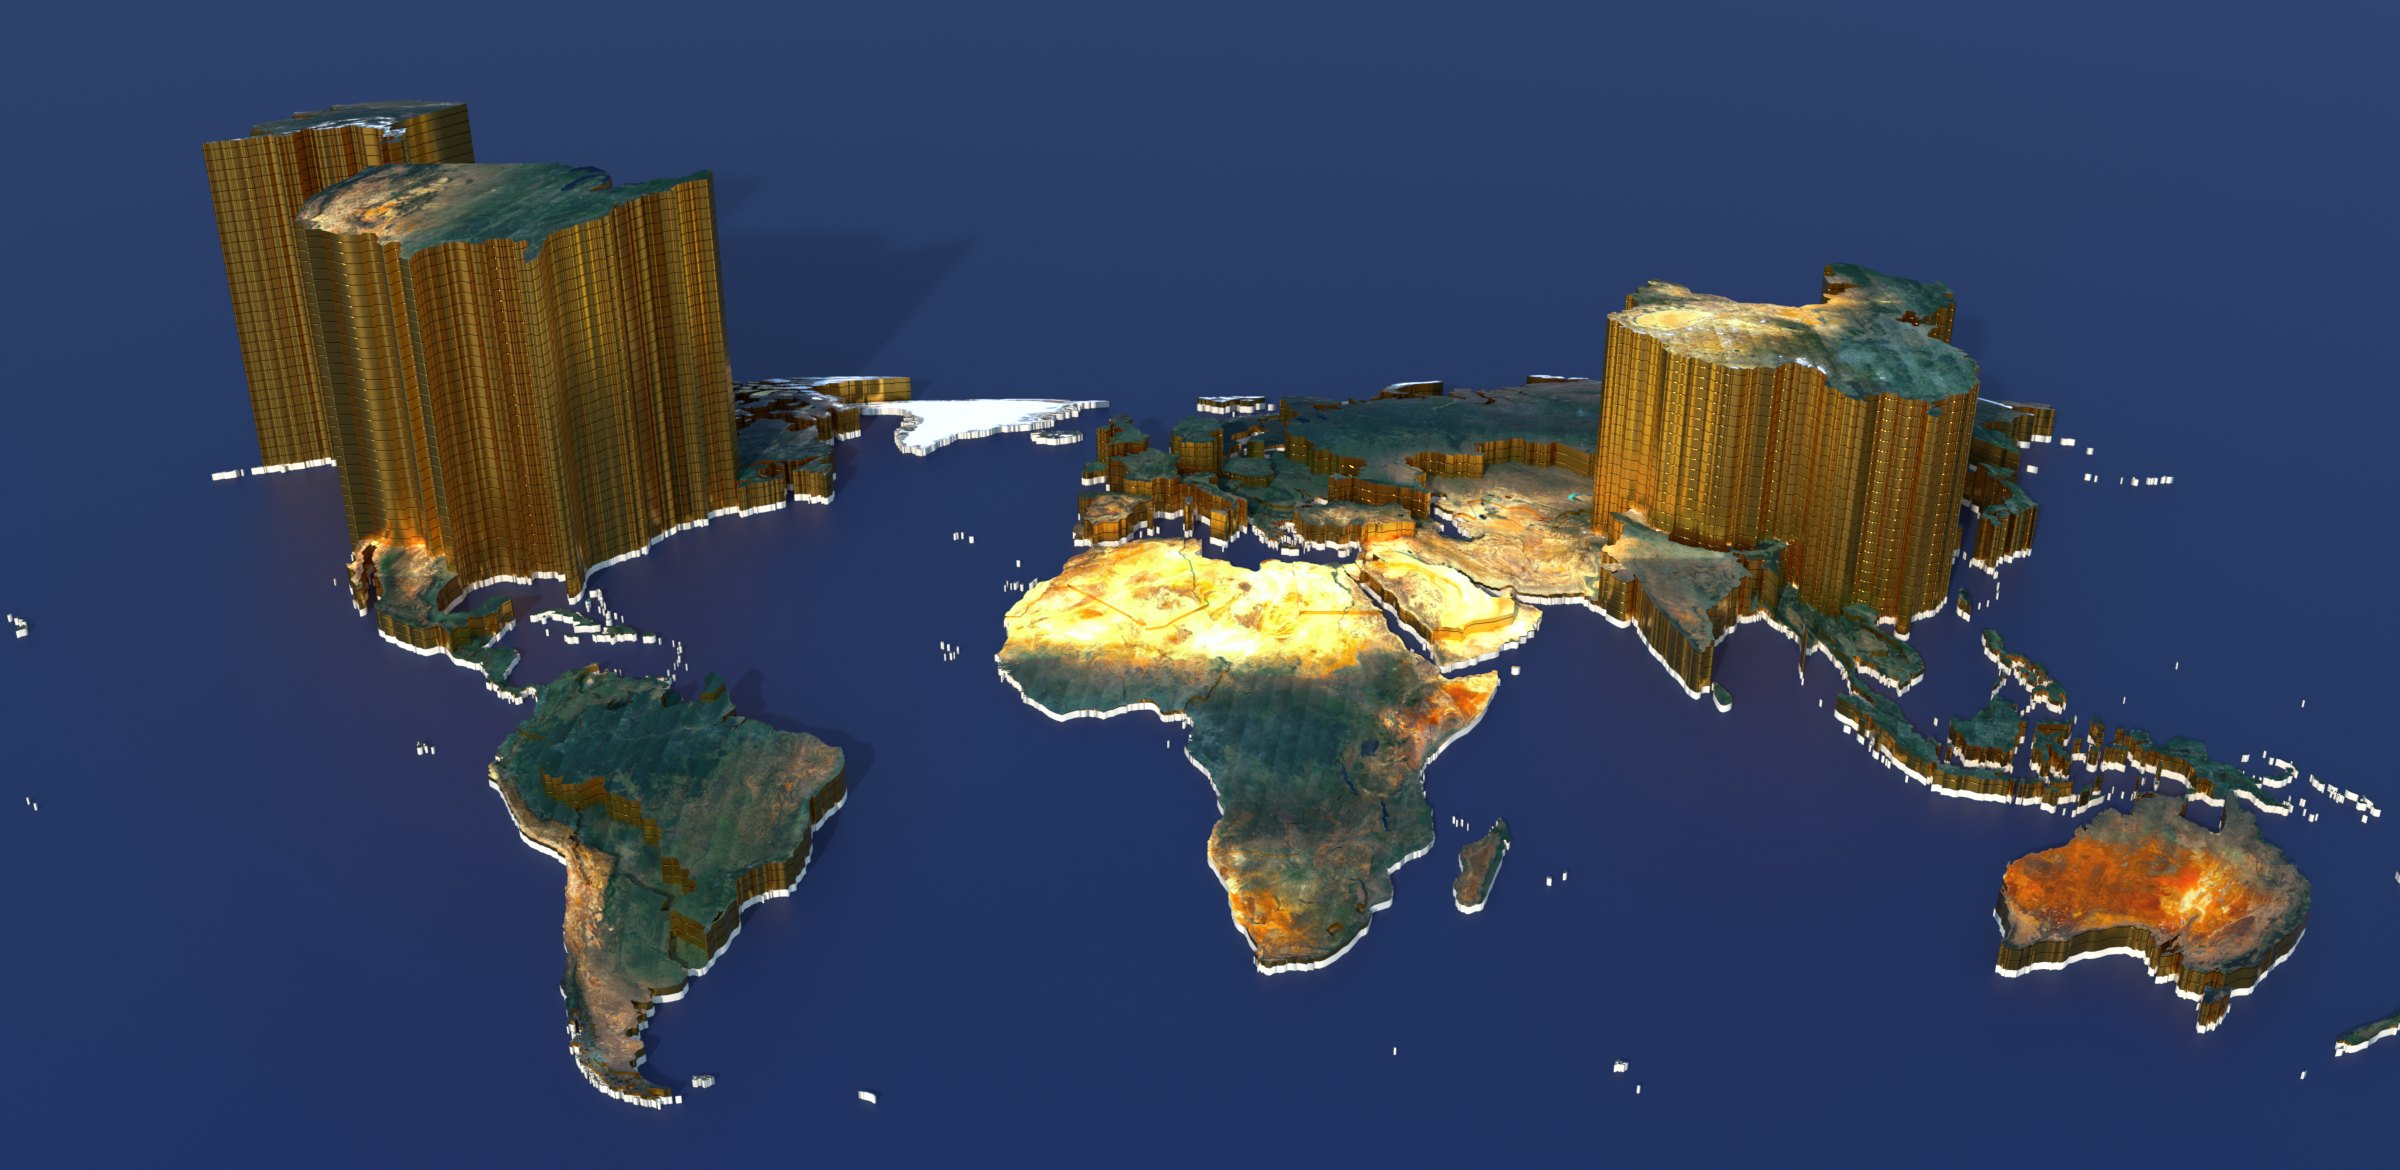
Gold under the land
Each economy’s real territory with relief and satellite colour, set on a gold slab as thick as its 2026 GDP: same camera, same land size, so the gold compares from card to card. Tap a model to follow that country through the charts.
Grooves on the gold mark every $1 trillion. Land is shown at the same size for every country (see each scale bar); relief is exaggerated. Borders follow Natural Earth (de facto lines, not an endorsement of any claim).
Poster
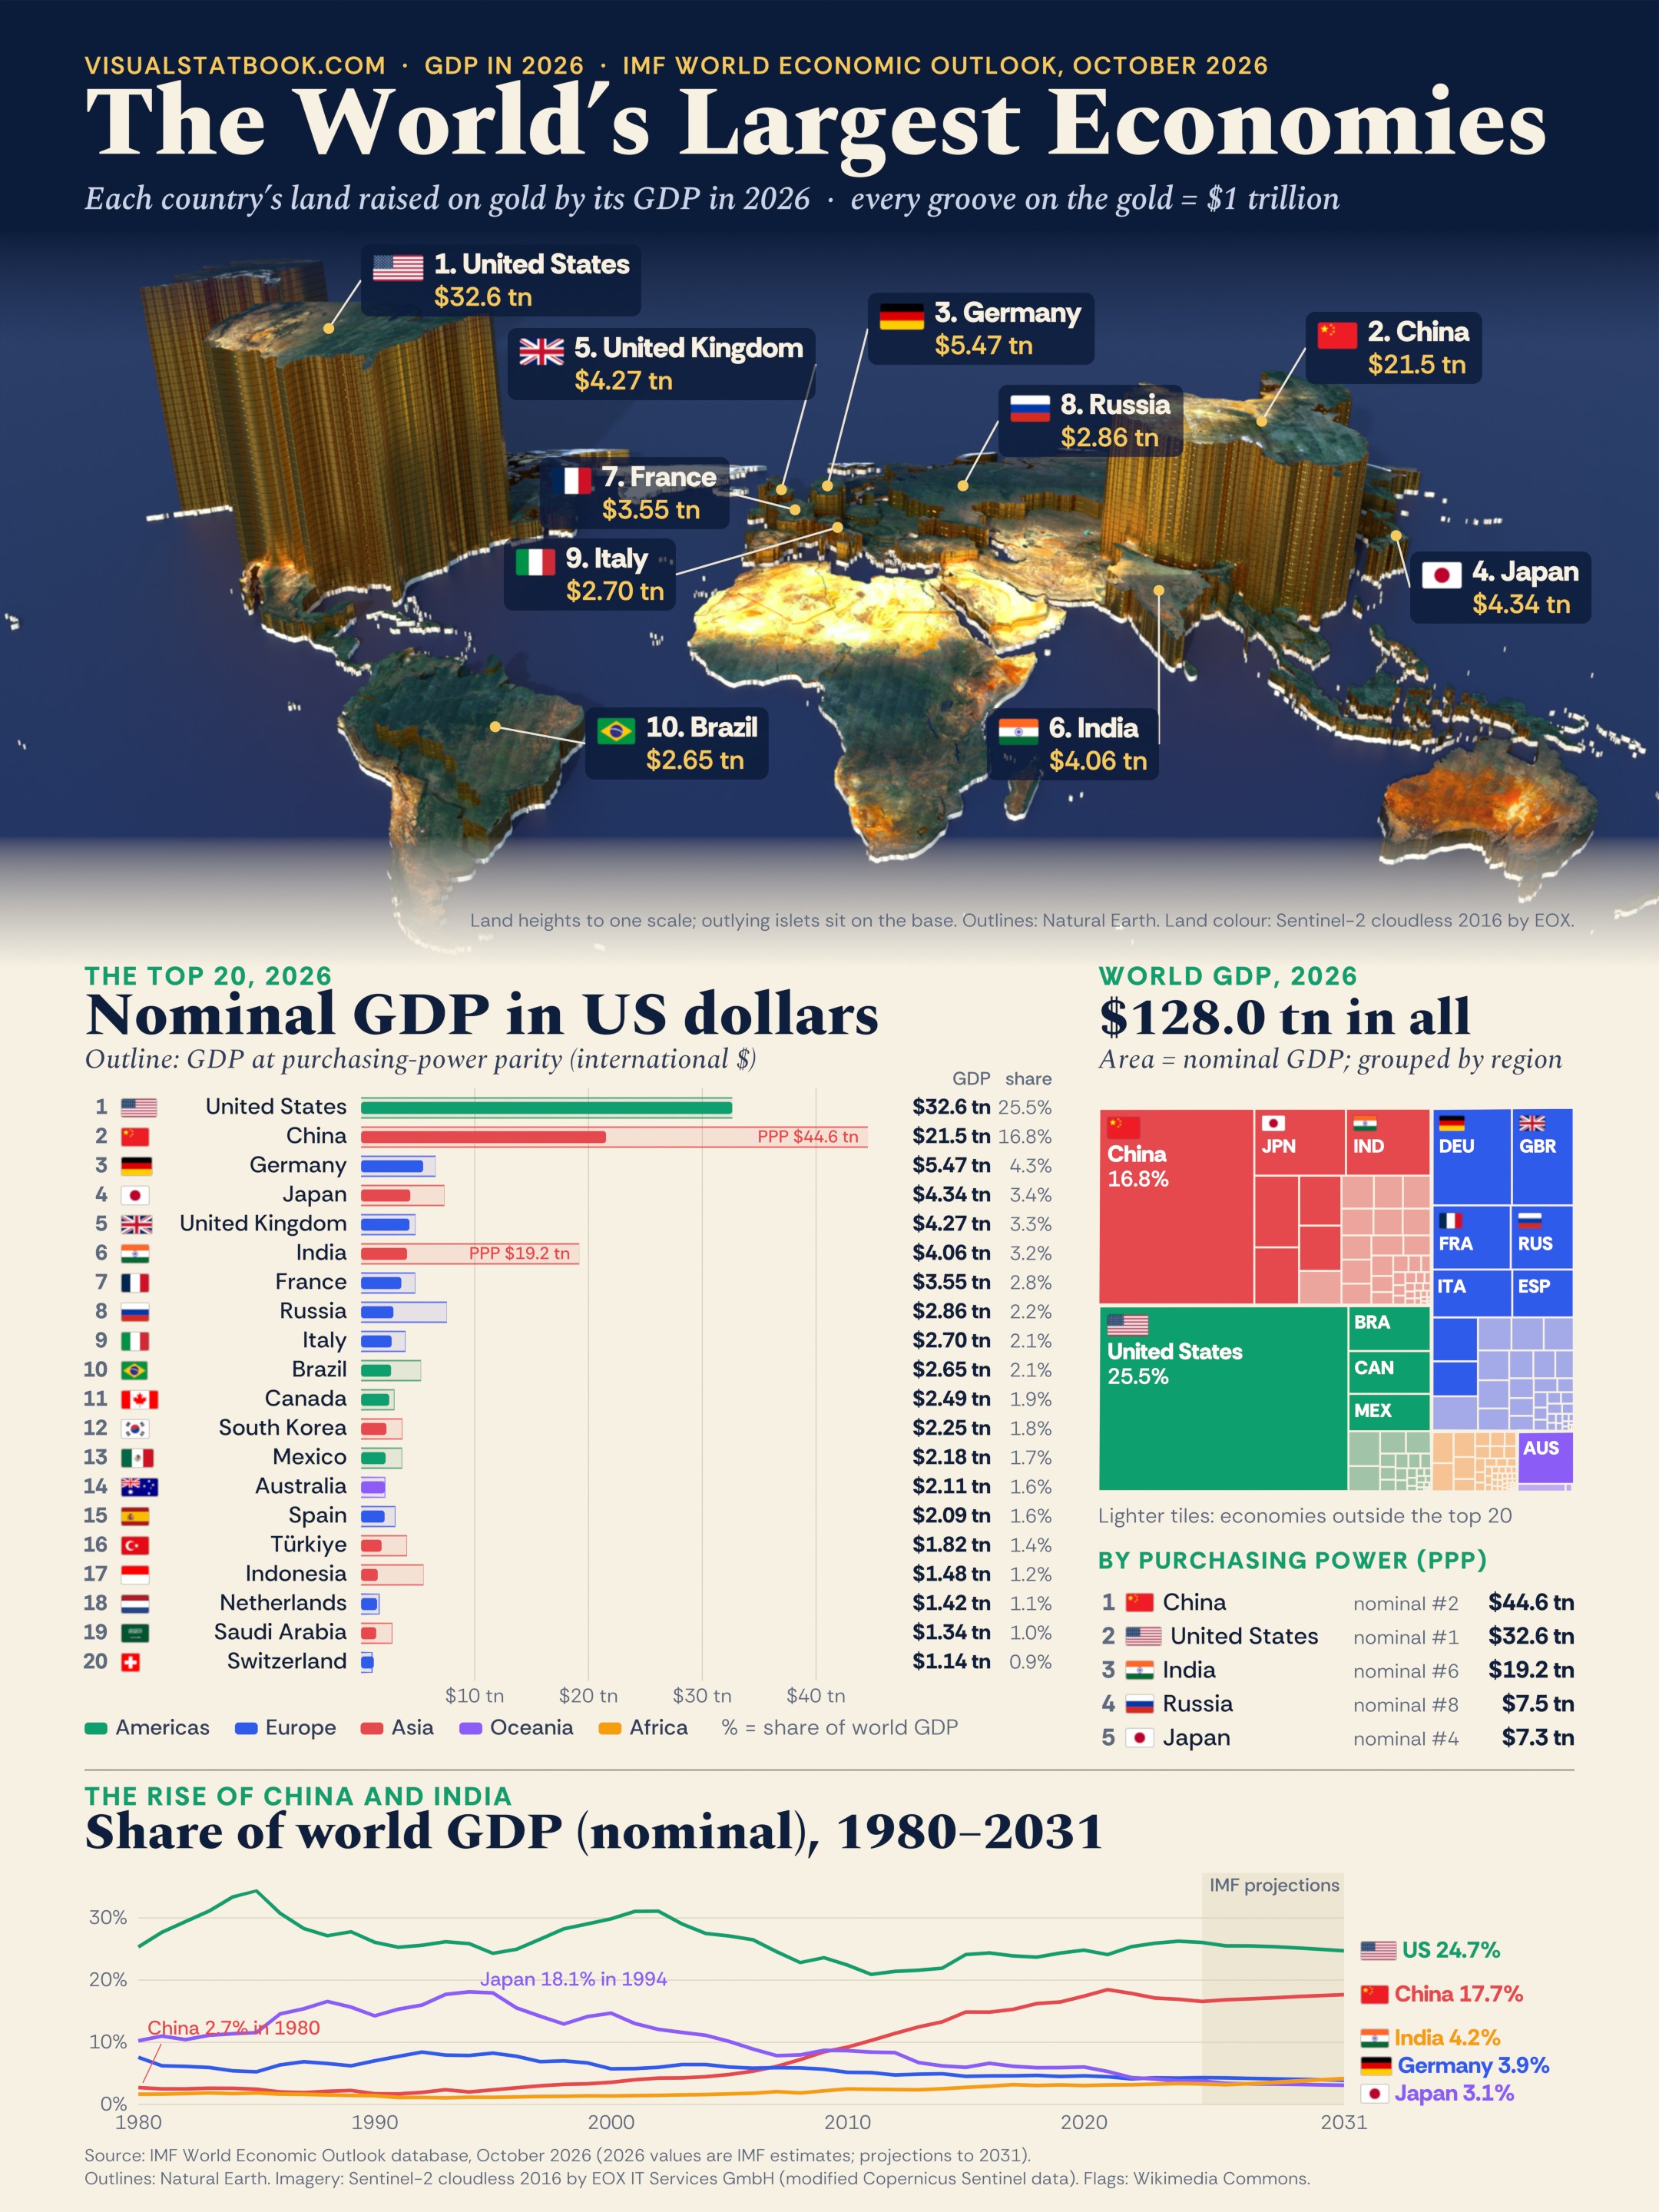
The whole story on one page
The gold map, the top 20, a treemap of world GDP and the 1980–2031 shares.
Open the full-size posterAll economies, 2026
Show the full data table
| Rank | Economy | Region | GDP, US$ bn | Share of world | GDP (PPP), int’l $ bn | PPP rank | Population, m | GDP per person, US$ | Real growth 2026 |
|---|---|---|---|---|---|---|---|---|---|
| 1 | United States | Americas | 32,642.4 | 25.50% | 32,642.4 | 2 | 343 | 95,212 | +2.3% |
| 2 | China | Asia | 21,546.4 | 16.83% | 44,555.0 | 1 | 1,402 | 15,371 | +4.5% |
| 3 | Germany | Europe | 5,471.3 | 4.27% | 6,551.0 | 6 | 83.3 | 65,699 | +1.3% |
| 4 | Japan | Asia | 4,342.0 | 3.39% | 7,324.1 | 5 | 123 | 35,400 | +0.8% |
| 5 | United Kingdom | Europe | 4,268.4 | 3.33% | 4,783.1 | 9 | 69.8 | 61,108 | +1.3% |
| 6 | India | Asia | 4,060.2 | 3.17% | 19,192.6 | 3 | 1,477 | 2,750 | +7.0% |
| 7 | France | Europe | 3,554.2 | 2.78% | 4,756.4 | 10 | 69.1 | 51,448 | +0.4% |
| 8 | Russia | Europe | 2,861.2 | 2.24% | 7,542.9 | 4 | 143 | 19,953 | +0.9% |
| 9 | Italy | Europe | 2,701.7 | 2.11% | 3,899.0 | 12 | 58.9 | 45,886 | +0.8% |
| 10 | Brazil | Americas | 2,654.8 | 2.07% | 5,266.5 | 8 | 214 | 12,397 | +2.2% |
| 11 | Canada | Americas | 2,490.3 | 1.95% | 2,915.7 | 16 | 41.4 | 60,105 | +1.1% |
| 12 | South Korea | Asia | 2,245.8 | 1.75% | 3,626.0 | 13 | 51.6 | 43,512 | +3.3% |
| 13 | Mexico | Americas | 2,176.2 | 1.70% | 3,594.4 | 14 | 134 | 16,191 | +1.5% |
| 14 | Australia | Oceania | 2,110.7 | 1.65% | 2,106.9 | 22 | 28.1 | 75,172 | +1.9% |
| 15 | Spain | Europe | 2,085.3 | 1.63% | 3,001.7 | 15 | 49.9 | 41,756 | +2.5% |
| 16 | Türkiye | Asia | 1,818.0 | 1.42% | 4,025.8 | 11 | 86.2 | 21,079 | +2.6% |
| 17 | Indonesia | Asia | 1,480.0 | 1.16% | 5,483.0 | 7 | 287 | 5,153 | +5.1% |
| 18 | Netherlands | Europe | 1,423.9 | 1.11% | 1,599.1 | 29 | 18.1 | 78,535 | +1.5% |
| 19 | Saudi Arabia | Asia | 1,343.3 | 1.05% | 2,728.6 | 17 | 36.7 | 36,577 | -3.3% |
| 20 | Switzerland | Europe | 1,135.7 | 0.89% | 975.8 | 36 | 9.1 | 124,478 | +1.9% |
| 21 | Poland | Europe | 1,133.1 | 0.89% | 2,181.8 | 21 | 36.3 | 31,186 | +3.4% |
| 22 | Taiwan | Asia | 1,019.6 | 0.80% | 2,406.7 | 20 | 23.2 | 43,951 | +10.7% |
| 23 | Belgium | Europe | 772.7 | 0.60% | 941.3 | 40 | 11.9 | 64,774 | +0.7% |
| 24 | Argentina | Americas | 768.2 | 0.60% | 1,577.5 | 30 | 47.9 | 16,021 | +2.1% |
| 25 | Israel | Asia | 747.0 | 0.58% | 619.7 | 50 | 10.3 | 72,441 | +4.5% |
| 26 | Sweden | Europe | 745.1 | 0.58% | 844.4 | 41 | 10.8 | 69,244 | +2.5% |
| 27 | Ireland | Europe | 710.0 | 0.55% | 831.1 | 42 | 5.6 | 127,837 | -1.0% |
| 28 | Singapore | Asia | 667.9 | 0.52% | 1,082.9 | 33 | 6.1 | 109,117 | +5.0% |
| 29 | United Arab Emirates | Asia | 661.0 | 0.52% | 968.8 | 37 | 11.6 | 57,109 | -3.9% |
| 30 | Norway | Europe | 651.7 | 0.51% | 657.3 | 48 | 5.7 | 115,188 | +1.5% |
| 31 | Austria | Europe | 616.9 | 0.48% | 725.6 | 44 | 9.2 | 67,020 | +0.6% |
| 32 | Thailand | Asia | 599.1 | 0.47% | 1,983.9 | 24 | 71.6 | 8,372 | +2.1% |
| 33 | Colombia | Americas | 572.7 | 0.45% | 1,262.0 | 32 | 53.4 | 10,726 | +2.2% |
| 34 | Malaysia | Asia | 547.1 | 0.43% | 1,624.5 | 28 | 34.2 | 15,981 | +5.2% |
| 35 | Vietnam | Asia | 542.1 | 0.42% | 2,058.9 | 23 | 103 | 5,259 | +8.4% |
| 36 | Bangladesh | Asia | 506.4 | 0.40% | 1,909.4 | 25 | 175 | 2,886 | +3.6% |
| 37 | Philippines | Asia | 501.7 | 0.39% | 1,569.8 | 31 | 115 | 4,360 | +3.4% |
| 38 | Denmark | Europe | 499.4 | 0.39% | 560.7 | 55 | 6.0 | 82,714 | +3.7% |
| 39 | South Africa | Africa | 489.1 | 0.38% | 1,075.4 | 34 | 63.9 | 7,659 | +1.0% |
| 40 | Romania | Europe | 470.1 | 0.37% | 942.9 | 39 | 19.0 | 24,741 | -0.5% |
| 41 | Hong Kong | Asia | 455.2 | 0.36% | 647.7 | 49 | 7.5 | 60,322 | +3.8% |
| 42 | Pakistan | Asia | 450.1 | 0.35% | 1,806.9 | 26 | 245 | 1,836 | +3.6% |
| 43 | Egypt | Africa | 442.9 | 0.35% | 2,600.0 | 18 | 110 | 4,024 | +5.1% |
| 44 | Czechia | Europe | 428.0 | 0.33% | 692.2 | 47 | 10.8 | 39,614 | +1.8% |
| 45 | Chile | Americas | 402.2 | 0.31% | 745.8 | 43 | 20.2 | 19,961 | +0.6% |
| 46 | Peru | Americas | 399.6 | 0.31% | 703.3 | 46 | 34.8 | 11,498 | +3.0% |
| 47 | Kazakhstan | Asia | 397.9 | 0.31% | 996.3 | 35 | 20.6 | 19,311 | +4.4% |
| 48 | Nigeria | Africa | 386.7 | 0.30% | 2,438.2 | 19 | 243 | 1,594 | +4.2% |
| 49 | Portugal | Europe | 375.2 | 0.29% | 571.0 | 52 | 10.8 | 34,815 | +2.1% |
| 50 | Finland | Europe | 338.6 | 0.26% | 395.4 | 62 | 5.6 | 60,156 | +1.7% |
| 51 | Algeria | Africa | 331.9 | 0.26% | 947.1 | 38 | 48.0 | 6,910 | +3.8% |
| 52 | Iran | Asia | 311.9 | 0.24% | 1,772.7 | 27 | 87.9 | 3,548 | -7.6% |
| 53 | Greece | Europe | 304.6 | 0.24% | 490.6 | 56 | 10.4 | 29,413 | +1.8% |
| 54 | New Zealand | Oceania | 273.4 | 0.21% | 313.7 | 69 | 5.4 | 51,043 | +2.0% |
| 55 | Hungary | Europe | 265.9 | 0.21% | 486.6 | 57 | 9.5 | 27,884 | +1.9% |
| 56 | Iraq | Asia | 245.2 | 0.19% | 606.6 | 51 | 46.6 | 5,258 | -16.0% |
| 57 | Ukraine | Europe | 229.4 | 0.18% | 720.7 | 45 | 32.4 | 7,075 | +1.0% |
| 58 | Qatar | Asia | 203.0 | 0.16% | 331.2 | 64 | 3.2 | 63,634 | -15.6% |
| 59 | Morocco | Africa | 195.6 | 0.15% | 472.8 | 58 | 38.0 | 5,141 | +4.5% |
| 60 | Uzbekistan | Asia | 178.2 | 0.14% | 561.6 | 53 | 38.9 | 4,575 | +7.8% |
| 61 | Slovakia | Europe | 167.1 | 0.13% | 269.2 | 76 | 5.4 | 30,884 | +0.8% |
| 62 | Angola | Africa | 157.3 | 0.12% | 434.8 | 60 | 40.6 | 3,876 | +4.4% |
| 63 | Kenya | Africa | 151.2 | 0.12% | 436.1 | 59 | 54.3 | 2,785 | +4.5% |
| 64 | Kuwait | Asia | 146.9 | 0.11% | 236.4 | 78 | 5.1 | 28,928 | -16.7% |
| 65 | Bulgaria | Europe | 146.5 | 0.11% | 284.1 | 73 | 6.4 | 23,000 | +2.6% |
| 66 | Dominican Republic | Americas | 145.4 | 0.11% | 357.7 | 63 | 11.0 | 13,245 | +4.6% |
| 67 | Ecuador | Americas | 138.2 | 0.11% | 325.3 | 67 | 18.2 | 7,575 | +2.7% |
| 68 | Puerto Rico | Americas | 133.2 | 0.10% | 171.6 | 89 | 3.2 | 41,851 | -0.1% |
| 69 | Guatemala | Americas | 132.3 | 0.10% | 305.1 | 70 | 18.9 | 6,980 | +4.0% |
| 70 | Ghana | Africa | 128.6 | 0.10% | 329.9 | 65 | 35.7 | 3,604 | +5.7% |
| 71 | Ethiopia | Africa | 127.1 | 0.10% | 561.3 | 54 | 112 | 1,131 | +9.2% |
| 72 | Venezuela | Americas | 124.2 | 0.10% | 282.4 | 74 | 28.5 | 4,355 | +5.0% |
| 73 | DR Congo | Africa | 122.3 | 0.10% | 235.3 | 79 | 110 | 1,111 | +5.2% |
| 74 | Oman | Asia | 121.4 | 0.09% | 250.1 | 77 | 5.4 | 22,425 | +4.1% |
| 75 | Croatia | Europe | 115.9 | 0.09% | 211.6 | 82 | 3.9 | 29,860 | +2.2% |
| 76 | Costa Rica | Americas | 115.3 | 0.09% | 185.3 | 86 | 5.4 | 21,282 | +3.3% |
| 77 | Serbia | Europe | 111.2 | 0.09% | 228.5 | 80 | 6.5 | 17,126 | +3.3% |
| 78 | Sri Lanka | Asia | 110.7 | 0.09% | 399.0 | 61 | 21.9 | 5,062 | +4.0% |
| 79 | Côte d'Ivoire | Africa | 110.4 | 0.09% | 294.2 | 71 | 33.8 | 3,264 | +6.0% |
| 80 | Luxembourg | Europe | 108.3 | 0.08% | 109.0 | 102 | 0.7 | 155,733 | +1.1% |
| 81 | Belarus | Europe | 108.1 | 0.08% | 325.6 | 66 | 9.0 | 11,963 | +1.9% |
| 82 | Lithuania | Europe | 104.7 | 0.08% | 177.4 | 88 | 2.9 | 36,135 | +2.7% |
| 83 | Panama | Americas | 96.5 | 0.08% | 217.8 | 81 | 4.6 | 20,877 | +5.0% |
| 84 | Tanzania | Africa | 96.2 | 0.08% | 322.7 | 68 | 72.6 | 1,325 | +6.0% |
| 85 | Uruguay | Americas | 95.2 | 0.07% | 135.8 | 97 | 3.5 | 27,339 | +1.3% |
| 86 | Azerbaijan | Asia | 89.2 | 0.07% | 281.1 | 75 | 10.5 | 8,497 | +1.7% |
| 87 | Slovenia | Europe | 88.9 | 0.07% | 132.9 | 99 | 2.1 | 41,631 | +3.2% |
| 88 | Myanmar | Asia | 83.2 | 0.06% | 291.6 | 72 | 55.2 | 1,507 | +2.0% |
| 89 | Turkmenistan | Asia | 83.0 | 0.06% | 164.8 | 90 | 6.8 | 12,291 | +2.4% |
| 90 | Uganda | Africa | 72.2 | 0.06% | 206.7 | 83 | 49.7 | 1,453 | +6.2% |
| 91 | Zimbabwe | Africa | 65.9 | 0.05% | 150.7 | 95 | 17.7 | 3,718 | +5.0% |
| 92 | Jordan | Asia | 64.9 | 0.05% | 154.5 | 93 | 11.6 | 5,598 | +2.7% |
| 93 | Cameroon | Africa | 64.8 | 0.05% | 184.9 | 87 | 30.6 | 2,115 | +3.2% |
| 94 | Paraguay | Americas | 64.0 | 0.05% | 152.9 | 94 | 6.5 | 9,907 | +4.5% |
| 95 | Tunisia | Africa | 62.7 | 0.05% | 198.9 | 84 | 12.4 | 5,053 | +2.4% |
| 96 | Libya | Africa | 56.9 | 0.04% | 137.3 | 96 | 7.5 | 7,557 | +3.3% |
| 97 | Macao | Asia | 54.7 | 0.04% | 100.3 | 106 | 0.7 | 77,049 | +3.3% |
| 98 | Cambodia | Asia | 54.2 | 0.04% | 160.1 | 92 | 18.1 | 3,001 | +3.0% |
| 99 | Bolivia | Americas | 53.8 | 0.04% | 162.4 | 91 | 12.7 | 4,223 | -3.0% |
| 100 | Latvia | Europe | 53.2 | 0.04% | 85.5 | 111 | 1.9 | 28,630 | +2.3% |
| 101 | Estonia | Europe | 51.0 | 0.04% | 73.4 | 118 | 1.4 | 37,310 | +2.1% |
| 102 | Bahrain | Asia | 46.0 | 0.04% | 104.2 | 104 | 1.6 | 28,147 | -11.3% |
| 103 | Nepal | Asia | 45.6 | 0.04% | 195.8 | 85 | 29.6 | 1,540 | +3.6% |
| 104 | Guinea | Africa | 45.3 | 0.04% | 129.8 | 100 | 16.2 | 2,797 | +7.2% |
| 105 | Cyprus | Asia | 44.3 | 0.03% | 68.0 | 122 | 1.0 | 44,477 | +2.9% |
| 106 | Georgia | Asia | 44.1 | 0.03% | 128.2 | 101 | 3.9 | 11,234 | +7.2% |
| 107 | Iceland | Europe | 42.8 | 0.03% | 33.0 | 147 | 0.4 | 107,464 | +1.4% |
| 108 | Zambia | Africa | 42.4 | 0.03% | 104.7 | 103 | 22.5 | 1,882 | +5.6% |
| 109 | Honduras | Americas | 41.0 | 0.03% | 92.5 | 110 | 11.2 | 3,663 | +3.3% |
| 110 | Guyana | Americas | 40.3 | 0.03% | 103.4 | 105 | 1.0 | 38,572 | +22.3% |
| 111 | Haiti | Americas | 39.4 | 0.03% | 38.3 | 142 | 12.7 | 3,095 | -1.7% |
| 112 | El Salvador | Americas | 39.4 | 0.03% | 96.9 | 107 | 6.4 | 6,124 | +4.5% |
| 113 | Bosnia and Herzegovina | Europe | 37.3 | 0.03% | 83.7 | 112 | 3.4 | 10,845 | +2.3% |
| 114 | Papua New Guinea | Oceania | 36.3 | 0.03% | 52.3 | 132 | 10.6 | 3,418 | +3.1% |
| 115 | Mali | Africa | 34.9 | 0.03% | 95.8 | 108 | 26.0 | 1,343 | +5.5% |
| 116 | Armenia | Asia | 33.0 | 0.03% | 83.2 | 113 | 3.1 | 10,662 | +5.5% |
| 117 | Albania | Europe | 32.8 | 0.03% | 67.6 | 123 | 2.3 | 13,968 | +3.5% |
| 118 | Burkina Faso | Africa | 32.4 | 0.03% | 79.8 | 115 | 24.6 | 1,316 | +4.4% |
| 119 | Mongolia | Asia | 31.1 | 0.02% | 81.5 | 114 | 3.6 | 8,570 | +6.2% |
| 120 | Sudan | Africa | 30.9 | 0.02% | 133.2 | 98 | 51.7 | 597 | +7.0% |
| 121 | Malta | Europe | 30.5 | 0.02% | 46.8 | 134 | 0.6 | 52,149 | +4.2% |
| 122 | Benin | Africa | 27.4 | 0.02% | 78.9 | 116 | 15.2 | 1,799 | +7.0% |
| 123 | Trinidad and Tobago | Americas | 26.8 | 0.02% | 52.9 | 131 | 1.4 | 18,603 | +0.2% |
| 124 | Kyrgyzstan | Asia | 26.7 | 0.02% | 76.2 | 117 | 7.4 | 3,620 | +9.0% |
| 125 | Gabon | Africa | 26.0 | 0.02% | 61.8 | 128 | 2.4 | 11,034 | +3.0% |
| 126 | Nicaragua | Americas | 25.4 | 0.02% | 69.8 | 120 | 6.8 | 3,732 | +3.8% |
| 127 | Chad | Africa | 25.2 | 0.02% | 66.9 | 125 | 19.5 | 1,295 | +4.5% |
| 128 | Mozambique | Africa | 24.8 | 0.02% | 63.4 | 127 | 36.8 | 673 | +1.0% |
| 129 | Jamaica | Americas | 23.9 | 0.02% | 39.0 | 141 | 2.8 | 8,674 | +0.0% |
| 130 | Niger | Africa | 23.4 | 0.02% | 66.8 | 126 | 30.2 | 774 | +7.0% |
| 131 | Moldova | Europe | 22.2 | 0.02% | 49.6 | 133 | 2.3 | 9,497 | +1.5% |
| 132 | Botswana | Africa | 22.1 | 0.02% | 57.2 | 130 | 2.6 | 8,563 | +4.4% |
| 133 | North Macedonia | Europe | 21.2 | 0.02% | 57.8 | 129 | 1.8 | 11,762 | +3.5% |
| 134 | Tajikistan | Asia | 21.1 | 0.02% | 70.8 | 119 | 10.5 | 2,005 | +7.3% |
| 135 | Madagascar | Africa | 21.0 | 0.02% | 68.7 | 121 | 32.3 | 649 | +3.8% |
| 136 | Congo | Africa | 19.1 | 0.01% | 45.5 | 136 | 6.7 | 2,867 | +3.5% |
| 137 | Brunei | Asia | 18.9 | 0.01% | 45.6 | 135 | 0.5 | 40,613 | +1.9% |
| 138 | Rwanda | Africa | 18.7 | 0.01% | 67.3 | 124 | 14.5 | 1,290 | +7.4% |
| 139 | Laos | Asia | 18.4 | 0.01% | 95.1 | 109 | 7.9 | 2,331 | +4.5% |
| 140 | Malawi | Africa | 18.3 | 0.01% | 45.0 | 137 | 24.8 | 740 | +2.6% |
| 141 | The Bahamas | Americas | 18.3 | 0.01% | 19.7 | 151 | 0.4 | 43,858 | +2.5% |
| 142 | Namibia | Africa | 17.9 | 0.01% | 39.1 | 140 | 3.1 | 5,742 | +2.0% |
| 143 | Mauritius | Africa | 16.9 | 0.01% | 43.9 | 138 | 1.2 | 13,671 | +2.7% |
| 144 | Somalia | Africa | 14.8 | 0.01% | 34.5 | 145 | 17.4 | 850 | +2.2% |
| 145 | Equatorial Guinea | Africa | 14.3 | 0.01% | 31.8 | 148 | 1.7 | 8,484 | -1.7% |
| 146 | Mauritania | Africa | 14.3 | 0.01% | 43.7 | 139 | 4.7 | 3,015 | +4.4% |
| 147 | Kosovo | Europe | 14.2 | 0.01% | 34.4 | 146 | 1.6 | 8,902 | +3.5% |
| 148 | Togo | Africa | 13.1 | 0.01% | 38.0 | 143 | 8.9 | 1,480 | +5.0% |
| 149 | Yemen | Asia | 11.0 | 0.01% | 30.4 | 149 | 19.4 | 567 | -1.5% |
| 150 | Montenegro | Europe | 10.1 | 0.01% | 22.8 | 150 | 0.6 | 16,211 | +3.0% |
| 151 | Liechtenstein | Europe | 9.6 | 0.01% | 8.3 | 163 | 0.0 | 230,417 | +1.0% |
| 152 | Sierra Leone | Africa | 8.5 | 0.01% | 35.4 | 144 | 9.0 | 946 | +4.0% |
| 153 | Barbados | Americas | 8.3 | 0.01% | 7.7 | 165 | 0.3 | 28,245 | +1.8% |
| 154 | Maldives | Asia | 8.1 | 0.01% | 15.8 | 157 | 0.4 | 19,507 | +1.0% |
| 155 | South Sudan | Africa | 8.0 | 0.01% | 19.7 | 152 | 12.4 | 642 | +10.5% |
| 156 | Burundi | Africa | 7.6 | 0.01% | 15.4 | 158 | 14.9 | 510 | +3.6% |
| 157 | Fiji | Oceania | 6.6 | 0.01% | 16.0 | 155 | 0.9 | 7,034 | +1.9% |
| 158 | Eswatini | Africa | 6.1 | 0.00% | 17.0 | 153 | 1.3 | 4,775 | +3.7% |
| 159 | Suriname | Americas | 6.0 | 0.00% | 15.8 | 156 | 0.7 | 8,965 | +4.0% |
| 160 | Liberia | Africa | 5.7 | 0.00% | 12.4 | 159 | 5.9 | 976 | +5.5% |
| 161 | Central African Republic | Africa | 5.1 | 0.00% | 12.4 | 160 | 5.7 | 891 | +2.7% |
| 162 | Andorra | Europe | 4.9 | 0.00% | 6.9 | 169 | 0.1 | 53,988 | +1.9% |
| 163 | Djibouti | Africa | 4.9 | 0.00% | 10.8 | 162 | 1.1 | 4,556 | +5.6% |
| 164 | Aruba | Americas | 4.7 | 0.00% | 6.5 | 171 | 0.1 | 42,934 | +3.7% |
| 165 | Bhutan | Asia | 3.9 | 0.00% | 16.1 | 154 | 0.8 | 4,933 | +7.0% |
| 166 | Belize | Americas | 3.4 | 0.00% | 6.7 | 170 | 0.4 | 8,078 | +1.9% |
| 167 | Cabo Verde | Africa | 3.4 | 0.00% | 7.0 | 168 | 0.5 | 6,556 | +5.0% |
| 168 | Lesotho | Africa | 3.1 | 0.00% | 7.9 | 164 | 2.4 | 1,298 | +1.1% |
| 169 | The Gambia | Africa | 3.0 | 0.00% | 11.4 | 161 | 2.9 | 1,030 | +5.1% |
| 170 | Guinea-Bissau | Africa | 2.9 | 0.00% | 7.2 | 167 | 2.1 | 1,429 | +4.7% |
| 171 | St Lucia | Americas | 2.8 | 0.00% | 5.4 | 172 | 0.2 | 15,091 | +1.2% |
| 172 | San Marino | Europe | 2.4 | 0.00% | 3.0 | 176 | 0.0 | 70,662 | +1.3% |
| 173 | Antigua and Barbuda | Americas | 2.4 | 0.00% | 3.5 | 175 | 0.1 | 22,504 | +2.4% |
| 174 | Seychelles | Africa | 2.4 | 0.00% | 4.6 | 173 | 0.1 | 19,157 | +1.0% |
| 175 | Timor-Leste | Asia | 2.2 | 0.00% | 7.5 | 166 | 1.4 | 1,520 | +4.0% |
| 176 | Solomon Islands | Oceania | 1.9 | 0.00% | 2.2 | 179 | 0.8 | 2,295 | +2.7% |
| 177 | Comoros | Africa | 1.7 | 0.00% | 3.9 | 174 | 0.9 | 1,859 | +2.9% |
| 178 | Grenada | Americas | 1.6 | 0.00% | 2.7 | 177 | 0.1 | 13,298 | +3.9% |
| 179 | Vanuatu | Oceania | 1.4 | 0.00% | 1.4 | 184 | 0.3 | 4,052 | +3.5% |
| 180 | Samoa | Oceania | 1.3 | 0.00% | 1.9 | 180 | 0.2 | 6,303 | +0.4% |
| 181 | St Vincent and the Grenadines | Americas | 1.3 | 0.00% | 2.4 | 178 | 0.1 | 11,404 | +2.3% |
| 182 | St Kitts and Nevis | Americas | 1.1 | 0.00% | 1.8 | 181 | 0.1 | 22,237 | +1.8% |
| 183 | São Tomé and Príncipe | Africa | 1.1 | 0.00% | 1.6 | 182 | 0.2 | 4,582 | +0.4% |
| 184 | Dominica | Americas | 0.8 | 0.00% | 1.6 | 183 | 0.1 | 10,428 | +3.1% |
| 185 | Tonga | Oceania | 0.7 | 0.00% | 0.9 | 185 | 0.1 | 7,343 | +1.8% |
| 186 | Micronesia | Oceania | 0.5 | 0.00% | 0.5 | 187 | 0.1 | 7,010 | +1.4% |
| 187 | Kiribati | Oceania | 0.4 | 0.00% | 0.5 | 186 | 0.1 | 3,058 | +3.0% |
| 188 | Palau | Oceania | 0.4 | 0.00% | 0.4 | 188 | 0.0 | 21,308 | +4.3% |
| 189 | Marshall Islands | Oceania | 0.3 | 0.00% | 0.3 | 189 | 0.0 | 9,085 | +3.0% |
| 190 | Nauru | Oceania | 0.2 | 0.00% | 0.2 | 190 | 0.0 | 16,076 | +2.1% |
| 191 | Tuvalu | Oceania | 0.1 | 0.00% | 0.1 | 191 | 0.0 | 8,367 | +3.4% |
Questions
What is the largest economy in the world?
The United States. The IMF’s October 2026 World Economic Outlook puts US GDP at $32.6 trillion in 2026, 25.5% of the world’s $128.0 trillion. China is second with $21.5 trillion (16.8%), then Germany ($5.47 trillion), Japan ($4.34 trillion) and the United Kingdom ($4.27 trillion).
Which is the largest economy at purchasing-power parity (PPP)?
China. Valued at purchasing-power parity its 2026 GDP is about 44.6 trillion international dollars, 19.9% of world GDP at PPP, ahead of the United States ($32.6 trillion, 14.6%) and India ($19.2 trillion, 8.6%).
What is the difference between nominal GDP and GDP at PPP?
Nominal GDP converts each economy’s output into US dollars at market exchange rates, which suits comparisons of trade and financial weight. GDP at PPP uses price levels instead, so a dollar buys the same basket everywhere; it raises economies where prices are low, such as India, China and Russia.
How big is the world economy in 2026?
About $128.0 trillion at market exchange rates and about 224.3 trillion international dollars at purchasing-power parity, according to the IMF’s October 2026 estimates. The 20 largest economies produce 80% of the nominal total and the top two 42%.
When will India become the third-largest economy?
India is sixth in 2026 at $4.06 trillion, just behind the United Kingdom. On the IMF’s October 2026 projections it passes the United Kingdom and Japan in 2027 and Germany in 2031, becoming the third-largest economy in US dollars. At purchasing-power parity it is already third.
How has China’s share of the world economy changed?
China produced 2.7% of world GDP in 1980 at market exchange rates. It passed Japan to become the second-largest economy in 2010, peaked at 18.5% in 2021 and stands at 16.8% in 2026; the IMF projects 17.7% for 2031.