


Home Largest Cities
Home Largest Cities
UN World Urbanization Prospects 2025 · every city over 5 million
Jakarta is now the world’s largest city, with 41.9 million people, ahead of Dhaka (36.6 million) and Tokyo (33.4 million). That is the verdict of the United Nations’ World Urbanization Prospects 2025, the first edition to measure every city on Earth the same way: as one continuous built-up area of at least 1,500 people per square kilometre, wherever the administrative borders run. Below, all 82 cities with more than 5 million people move through time from 2000 to 2050. Press play and watch Dhaka overtake Jakarta, Tokyo slide, and Luanda grow sixteenfold.
Each shape is a city; its area is its population. Switch between a cluster by world region, a world map and a ranking, then drag the years. Tap any city for its numbers.
Populations are the UN’s estimates for 1 July 2000 and 2025 and its projection for 2050; years in between are interpolated at a steady growth rate. Ranks in the card are the UN’s ranks among all the world’s cities.
The heart of each of the 33 megacities as a 2.6 km square in 3D, every building at its mapped footprint and height, all at one scale. Tap a city to load it into the stage above and the comparator below.
Each block is centred on a well-known central point and drawn from the same angle, looking north-east. Heights come from OpenStreetMap height or floor tags; where a building has neither, it takes the average building height of its surroundings from the European Commission’s GHS-BUILT-H grid (2018, about 90 m cells). Where OpenStreetMap maps few buildings, as in parts of Lahore and Luanda, fewer appear. Ground relief is shown where it exceeds 30 m.
Pick any two cities and a year. The large disc is the first city; the coins are the second, at the same scale.
In 1975 eight cities had 10 million people or more, and they held under 3% of humanity. In 2025 there are 33 megacities, home to nearly 8% of the world. Nineteen are in Asia; India has five and China four. By 2050 the UN expects four more to join.
Average yearly population change from 2000 to 2025 among the 82 cities over 5 million. Luanda went from 0.7 million to 11.4 million in a quarter of a century; Osaka lost one and a half million people.
Older city rankings added up whatever each country called a city, often just the area inside its administrative borders. The Degree of Urbanization, endorsed by the UN Statistical Commission in 2021, lays a grid of 1-km² cells over the whole planet and draws the city wherever the density is: every contiguous cell with at least 1,500 people per km², as long as the cluster adds up to 50,000 people or more.
An illustrative city, not real data.
Indonesia’s official figures for Jakarta left out the densely built communities that run on without a break from the city centre into Bogor, Depok, Tangerang and Bekasi. Measured as one continuous city, Jakarta more than triples and jumps from thirtieth place to first.
The same rule cuts the other way where official borders are generous: a city counts only the people who actually live at city density, not farmland inside a vast municipality.
In 1950 one person in five lived in a city. In 2025 it is 45%, more than twice the share, and the UN expects about 48% of 9.7 billion people by 2050. Most cities are small: 96% have fewer than a million inhabitants.
Shares of world population: megacities nearly 8%, large cities 4%, medium-sized cities about 11%.
Every city with more than 5 million people in 2025, by the UN’s Degree of Urbanization. Population in millions; click a column to sort.
| Rank | City | Country | Region | 2000 | 2025 | 2050 | %/yr 2000–25 | Rank 2050 |
|---|---|---|---|---|---|---|---|---|
| 1 | Jakarta | Indonesia | Southeast Asia | 25.6 | 41.9 | 51.8 | +1.97 | 2 |
| 2 | Dhaka | Bangladesh | South Asia | 17.4 | 36.6 | 52.1 | +2.96 | 1 |
| 3 | Tokyo | Japan | East Asia | 30.3 | 33.4 | 30.7 | +0.39 | 7 |
| 4 | New Delhi | India | South Asia | 18.0 | 30.2 | 33.9 | +2.08 | 4 |
| 5 | Shanghai | China | East Asia | 14.0 | 29.6 | 34.9 | +2.98 | 3 |
| 6 | Guangzhou | China | East Asia | 19.0 | 27.6 | 29.2 | +1.49 | 8 |
| 7 | Cairo | Egypt | Africa & Middle East | 15.7 | 25.6 | 32.4 | +1.96 | 6 |
| 8 | Manila | Philippines | Southeast Asia | 17.8 | 24.7 | 27.1 | +1.32 | 9 |
| 9 | Kolkata | India | South Asia | 18.4 | 22.6 | 23.8 | +0.82 | 10 |
| 10 | Seoul | South Korea | East Asia | 19.0 | 22.5 | 21.2 | +0.68 | 12 |
| 11 | Karachi | Pakistan | South Asia | 10.8 | 21.4 | 32.6 | +2.74 | 5 |
| 12 | Mumbai | India | South Asia | 16.0 | 20.2 | 23.1 | +0.94 | 11 |
| 13 | São Paulo | Brazil | Americas | 16.7 | 18.9 | 18.2 | +0.51 | 16 |
| 14 | Bangkok | Thailand | Southeast Asia | 8.4 | 18.2 | 20.5 | +3.10 | 13 |
| 15 | Mexico City | Mexico | Americas | 17.6 | 17.7 | 17.7 | +0.03 | 18 |
| 16 | Beijing | China | East Asia | 9.6 | 17.0 | 18.0 | +2.27 | 17 |
| 17 | Lahore | Pakistan | South Asia | 8.0 | 15.2 | 20.4 | +2.57 | 14 |
| 18 | Istanbul | Türkiye | Europe | 10.6 | 15.0 | 16.3 | +1.38 | 20 |
| 19 | Moscow | Russia | Europe | 11.2 | 14.5 | 15.5 | +1.04 | 22 |
| 20 | Ho Chi Minh City | Vietnam | Southeast Asia | 6.0 | 14.1 | 17.2 | +3.40 | 19 |
| 21 | Buenos Aires | Argentina | Americas | 11.7 | 14.0 | 14.2 | +0.72 | 25 |
| 22 | New York City | United States | Americas | 13.0 | 13.9 | 13.2 | +0.26 | 28 |
| 23 | Shenzhen | China | East Asia | 8.2 | 13.9 | 14.7 | +2.11 | 23 |
| 24 | Bengaluru | India | South Asia | 6.1 | 13.2 | 14.3 | +3.12 | 24 |
| 25 | Osaka | Japan | East Asia | 14.5 | 13.0 | 10.4 | -0.44 | 37 |
| 26 | Lagos | Nigeria | Africa & Middle East | 7.9 | 12.8 | 16.2 | +1.92 | 21 |
| 27 | Los Angeles | United States | Americas | 11.2 | 12.7 | 13.9 | +0.52 | 26 |
| 28 | Luanda | Angola | Africa & Middle East | 0.7 | 11.4 | 20.3 | +11.07 | 15 |
| 29 | Chennai | India | South Asia | 7.6 | 11.2 | 11.8 | +1.53 | 34 |
| 30 | Kinshasa | DR Congo | Africa & Middle East | 5.3 | 10.9 | 13.2 | +2.88 | 29 |
| 31 | Bogotá | Colombia | Americas | 6.3 | 10.6 | 12.5 | +2.06 | 31 |
| 32 | Lima | Peru | Americas | 7.0 | 10.6 | 12.4 | +1.66 | 32 |
| 33 | London | United Kingdom | Europe | 7.7 | 10.4 | 11.9 | +1.23 | 33 |
| 34 | Hajipur | India | South Asia | 3.4 | 9.9 | 13.7 | +4.33 | 27 |
| 35 | Rio de Janeiro | Brazil | Americas | 8.4 | 9.5 | 9.3 | +0.48 | 45 |
| 36 | Paris | France | Europe | 8.4 | 9.4 | 9.3 | +0.45 | 44 |
| 37 | Hyderabad | India | South Asia | 6.3 | 9.2 | 9.5 | +1.48 | 41 |
| 38 | Tehran | Iran | Africa & Middle East | 7.0 | 9.2 | 9.5 | +1.08 | 42 |
| 39 | Taipei | Taiwan | East Asia | 7.9 | 9.1 | 8.2 | +0.58 | 54 |
| 40 | Bandung | Indonesia | Southeast Asia | 6.3 | 8.9 | 9.7 | +1.36 | 39 |
| 41 | Kuala Lumpur | Malaysia | Southeast Asia | 4.1 | 8.4 | 10.6 | +2.85 | 36 |
| 42 | Dar es Salaam | Tanzania | Africa & Middle East | 2.1 | 7.8 | 13.2 | +5.30 | 30 |
| 43 | Suzhou | China | East Asia | 3.7 | 7.7 | 7.6 | +2.98 | 59 |
| 44 | Ahmedabad | India | South Asia | 5.1 | 7.6 | 8.2 | +1.60 | 53 |
| 45 | Hangzhou | China | East Asia | 5.0 | 7.5 | 9.6 | +1.65 | 40 |
| 46 | Wuhan | China | East Asia | 5.6 | 7.4 | 6.2 | +1.07 | 71 |
| 47 | Tianjin | China | East Asia | 4.3 | 7.3 | 7.6 | +2.11 | 58 |
| 48 | Alexandria | Egypt | Africa & Middle East | 4.5 | 7.3 | 9.0 | +1.94 | 47 |
| 49 | Nagoya | Japan | East Asia | 6.5 | 7.1 | 6.3 | +0.38 | 69 |
| 50 | Johannesburg | South Africa | Africa & Middle East | 2.8 | 7.1 | 8.9 | +3.76 | 48 |
| 51 | Chongqing | China | East Asia | 5.3 | 7.1 | 6.1 | +1.17 | 72 |
| 52 | Riyadh | Saudi Arabia | Africa & Middle East | 2.6 | 6.9 | 9.2 | +3.98 | 46 |
| 53 | Surat | India | South Asia | 3.3 | 6.9 | 8.0 | +2.96 | 55 |
| 54 | Surabaya | Indonesia | Southeast Asia | 5.7 | 6.8 | 6.3 | +0.72 | 67 |
| 55 | Pune | India | South Asia | 4.3 | 6.8 | 7.7 | +1.80 | 57 |
| 56 | Khartoum | Sudan | Africa & Middle East | 4.1 | 6.8 | 9.4 | +2.00 | 43 |
| 57 | Nanjing | China | East Asia | 3.9 | 6.8 | 6.3 | +2.23 | 68 |
| 58 | Santiago | Chile | Americas | 5.3 | 6.7 | 6.9 | +0.95 | 64 |
| 59 | Addis Ababa | Ethiopia | Africa & Middle East | 2.8 | 6.7 | 10.8 | +3.51 | 35 |
| 60 | Abidjan | Côte d'Ivoire | Africa & Middle East | 3.4 | 6.6 | 9.8 | +2.62 | 38 |
| 61 | Chaozhou | China | East Asia | 4.2 | 6.4 | 6.8 | +1.68 | 66 |
| 62 | Amman | Jordan | Africa & Middle East | 2.6 | 6.4 | 8.4 | +3.55 | 52 |
| 63 | Baghdad | Iraq | Africa & Middle East | 4.3 | 6.4 | 7.5 | +1.61 | 60 |
| 64 | Chengdu | China | East Asia | 5.5 | 6.1 | 5.2 | +0.45 | 79 |
| 65 | Nairobi | Kenya | Africa & Middle East | 2.6 | 6.1 | 8.5 | +3.46 | 51 |
| 66 | Kozhikode | India | South Asia | 2.3 | 6.1 | 7.1 | +3.89 | 63 |
| 67 | Shenyang | China | East Asia | 4.6 | 5.7 | 5.1 | +0.87 | 80 |
| 68 | Kabul | Afghanistan | South Asia | 2.7 | 5.6 | 8.0 | +2.92 | 56 |
| 69 | Onitsha | Nigeria | Africa & Middle East | 2.4 | 5.6 | 8.7 | +3.49 | 49 |
| 70 | Yangon | Myanmar | Southeast Asia | 3.8 | 5.6 | 6.0 | +1.56 | 73 |
| 71 | Accra | Ghana | Africa & Middle East | 2.6 | 5.6 | 7.2 | +3.05 | 62 |
| 72 | Madrid | Spain | Europe | 3.9 | 5.6 | 5.6 | +1.41 | 78 |
| 73 | Faisalabad | Pakistan | South Asia | 2.8 | 5.6 | 7.3 | +2.72 | 61 |
| 74 | Toronto | Canada | Americas | 3.8 | 5.5 | 6.2 | +1.48 | 70 |
| 75 | Mashhad | Iran | Africa & Middle East | 3.5 | 5.4 | 5.7 | +1.77 | 77 |
| 76 | Dubai | United Arab Emirates | Africa & Middle East | 1.3 | 5.3 | 6.9 | +5.62 | 65 |
| 77 | Xi'an | China | East Asia | 4.0 | 5.2 | 4.7 | +1.09 | 82 |
| 78 | Colombo | Sri Lanka | South Asia | 3.8 | 5.2 | 5.8 | +1.25 | 75 |
| 79 | Yaoundé | Cameroon | Africa & Middle East | 1.6 | 5.1 | 8.7 | +4.70 | 50 |
| 80 | Kochi | India | South Asia | 3.4 | 5.1 | 5.8 | +1.61 | 74 |
| 81 | Hanoi | Vietnam | Southeast Asia | 3.0 | 5.1 | 4.8 | +2.07 | 81 |
| 82 | Lucknow | India | South Asia | 3.2 | 5.1 | 5.7 | +1.83 | 76 |
Jakarta, Indonesia, with 41.9 million people in 2025, according to the UN’s World Urbanization Prospects 2025. Dhaka (36.6 million) is second and Tokyo (33.4 million) third, followed by New Delhi, Shanghai, Guangzhou, Cairo, Manila, Kolkata and Seoul.
Because the UN changed how it measures cities. Earlier rankings used each country’s own definition, which for Jakarta covered only about 12 million people. The 2025 revision counts the whole continuous built-up area at 1,500 people per km² or more, which takes in the dense suburbs around Jakarta. Tokyo, meanwhile, has been shrinking slightly since about 2020.
33 cities had 10 million inhabitants or more in 2025, up from 8 in 1975. Nineteen are in Asia, five in Latin America, four in Africa, three in Europe and two in Northern America. By 2050 the UN projects 37, as Addis Ababa, Dar es Salaam, Hajipur and Kuala Lumpur cross the line.
Dhaka, with a projected 52.1 million people, just ahead of Jakarta (51.8 million). Shanghai is expected to rise to third (34.9 million), New Delhi to stay fourth and Karachi to climb to fifth with almost 33 million.
Under the Degree of Urbanization, a city is a cluster of contiguous one-square-kilometre grid cells that each have at least 1,500 inhabitants per km² and together hold at least 50,000 people. The rule is applied to satellite-based population grids for every country, so cities can be compared fairly around the world.
Luanda, the capital of Angola: 11.1% a year on average from 2000 to 2025, from 0.7 million to 11.4 million people. Dubai (5.6%) and Dar es Salaam (5.3%) follow among cities over 5 million.
Yes. Osaka fell from 14.5 million in 2000 to 13.0 million in 2025, and Mexico City from 19.0 million in 2015 to 17.7 million in 2025. Chengdu, Tokyo, Seoul and several Chinese cities are projected to be smaller in 2050 than today. More than 3,000 cities worldwide lost population in the last decade.
India, with five: New Delhi, Kolkata, Mumbai, Bengaluru and Chennai. China has four (Shanghai, Guangzhou, Beijing and Shenzhen). Cairo is the only city in the top ten that is not in Asia.
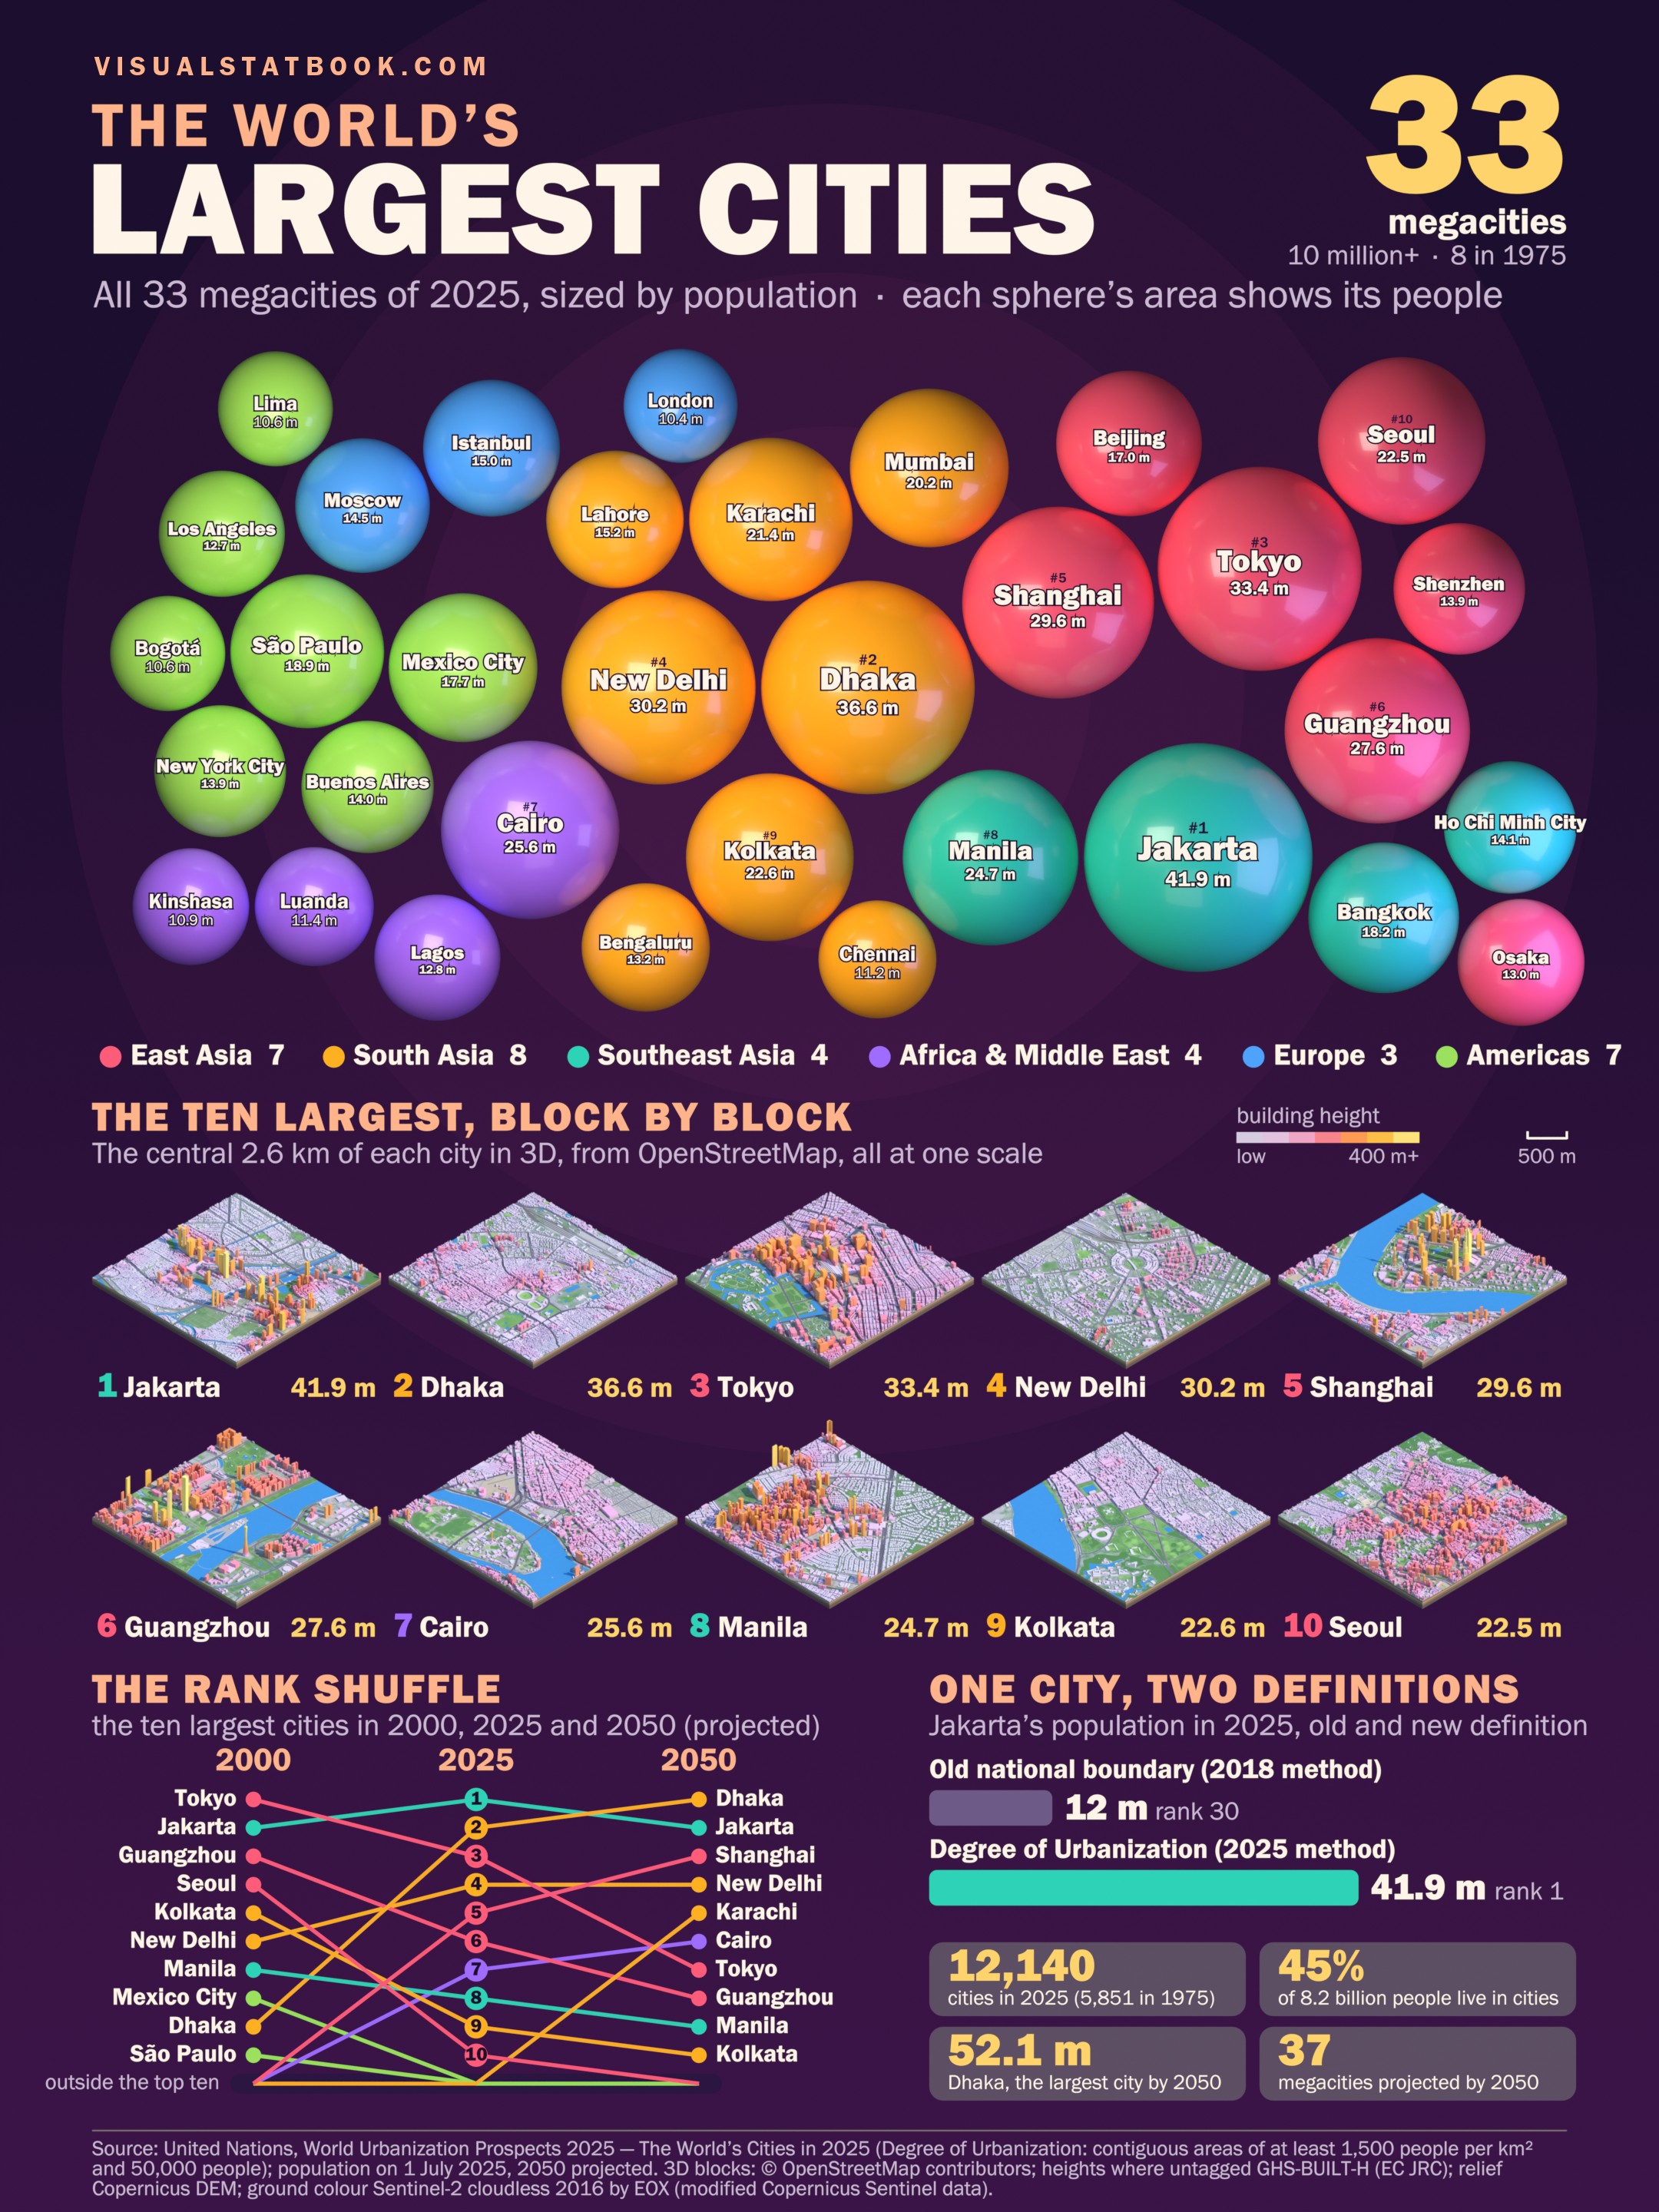
The poster
Every megacity of 2025 as a sphere whose area matches its population, grouped by world region and coloured to match this page.
Source: United Nations, Department of Economic and Social Affairs, Population Division (2025). World Urbanization Prospects 2025: The World’s Cities in 2025, Data Booklet, Annex table 3 and pages 2–12. City populations follow the Degree of Urbanization; 2050 figures are projections. Coordinates from OpenStreetMap Nominatim; coastlines from Natural Earth.
3D city blocks: buildings, roads, railways, water and parks © OpenStreetMap contributors (ODbL). Building heights where OpenStreetMap has none: GHS-BUILT-H R2023A, European Commission, Joint Research Centre. Relief: Copernicus DEM GLO-30 (© DLR e.V. 2010–2014 and © Airbus Defence and Space GmbH 2014–2018, provided under COPERNICUS by the European Union and ESA). Ground colour: Sentinel-2 cloudless 2016 by EOX IT Services GmbH (contains modified Copernicus Sentinel data 2016).
The grid in “One city, two definitions” is an illustrative example, not a real city.