


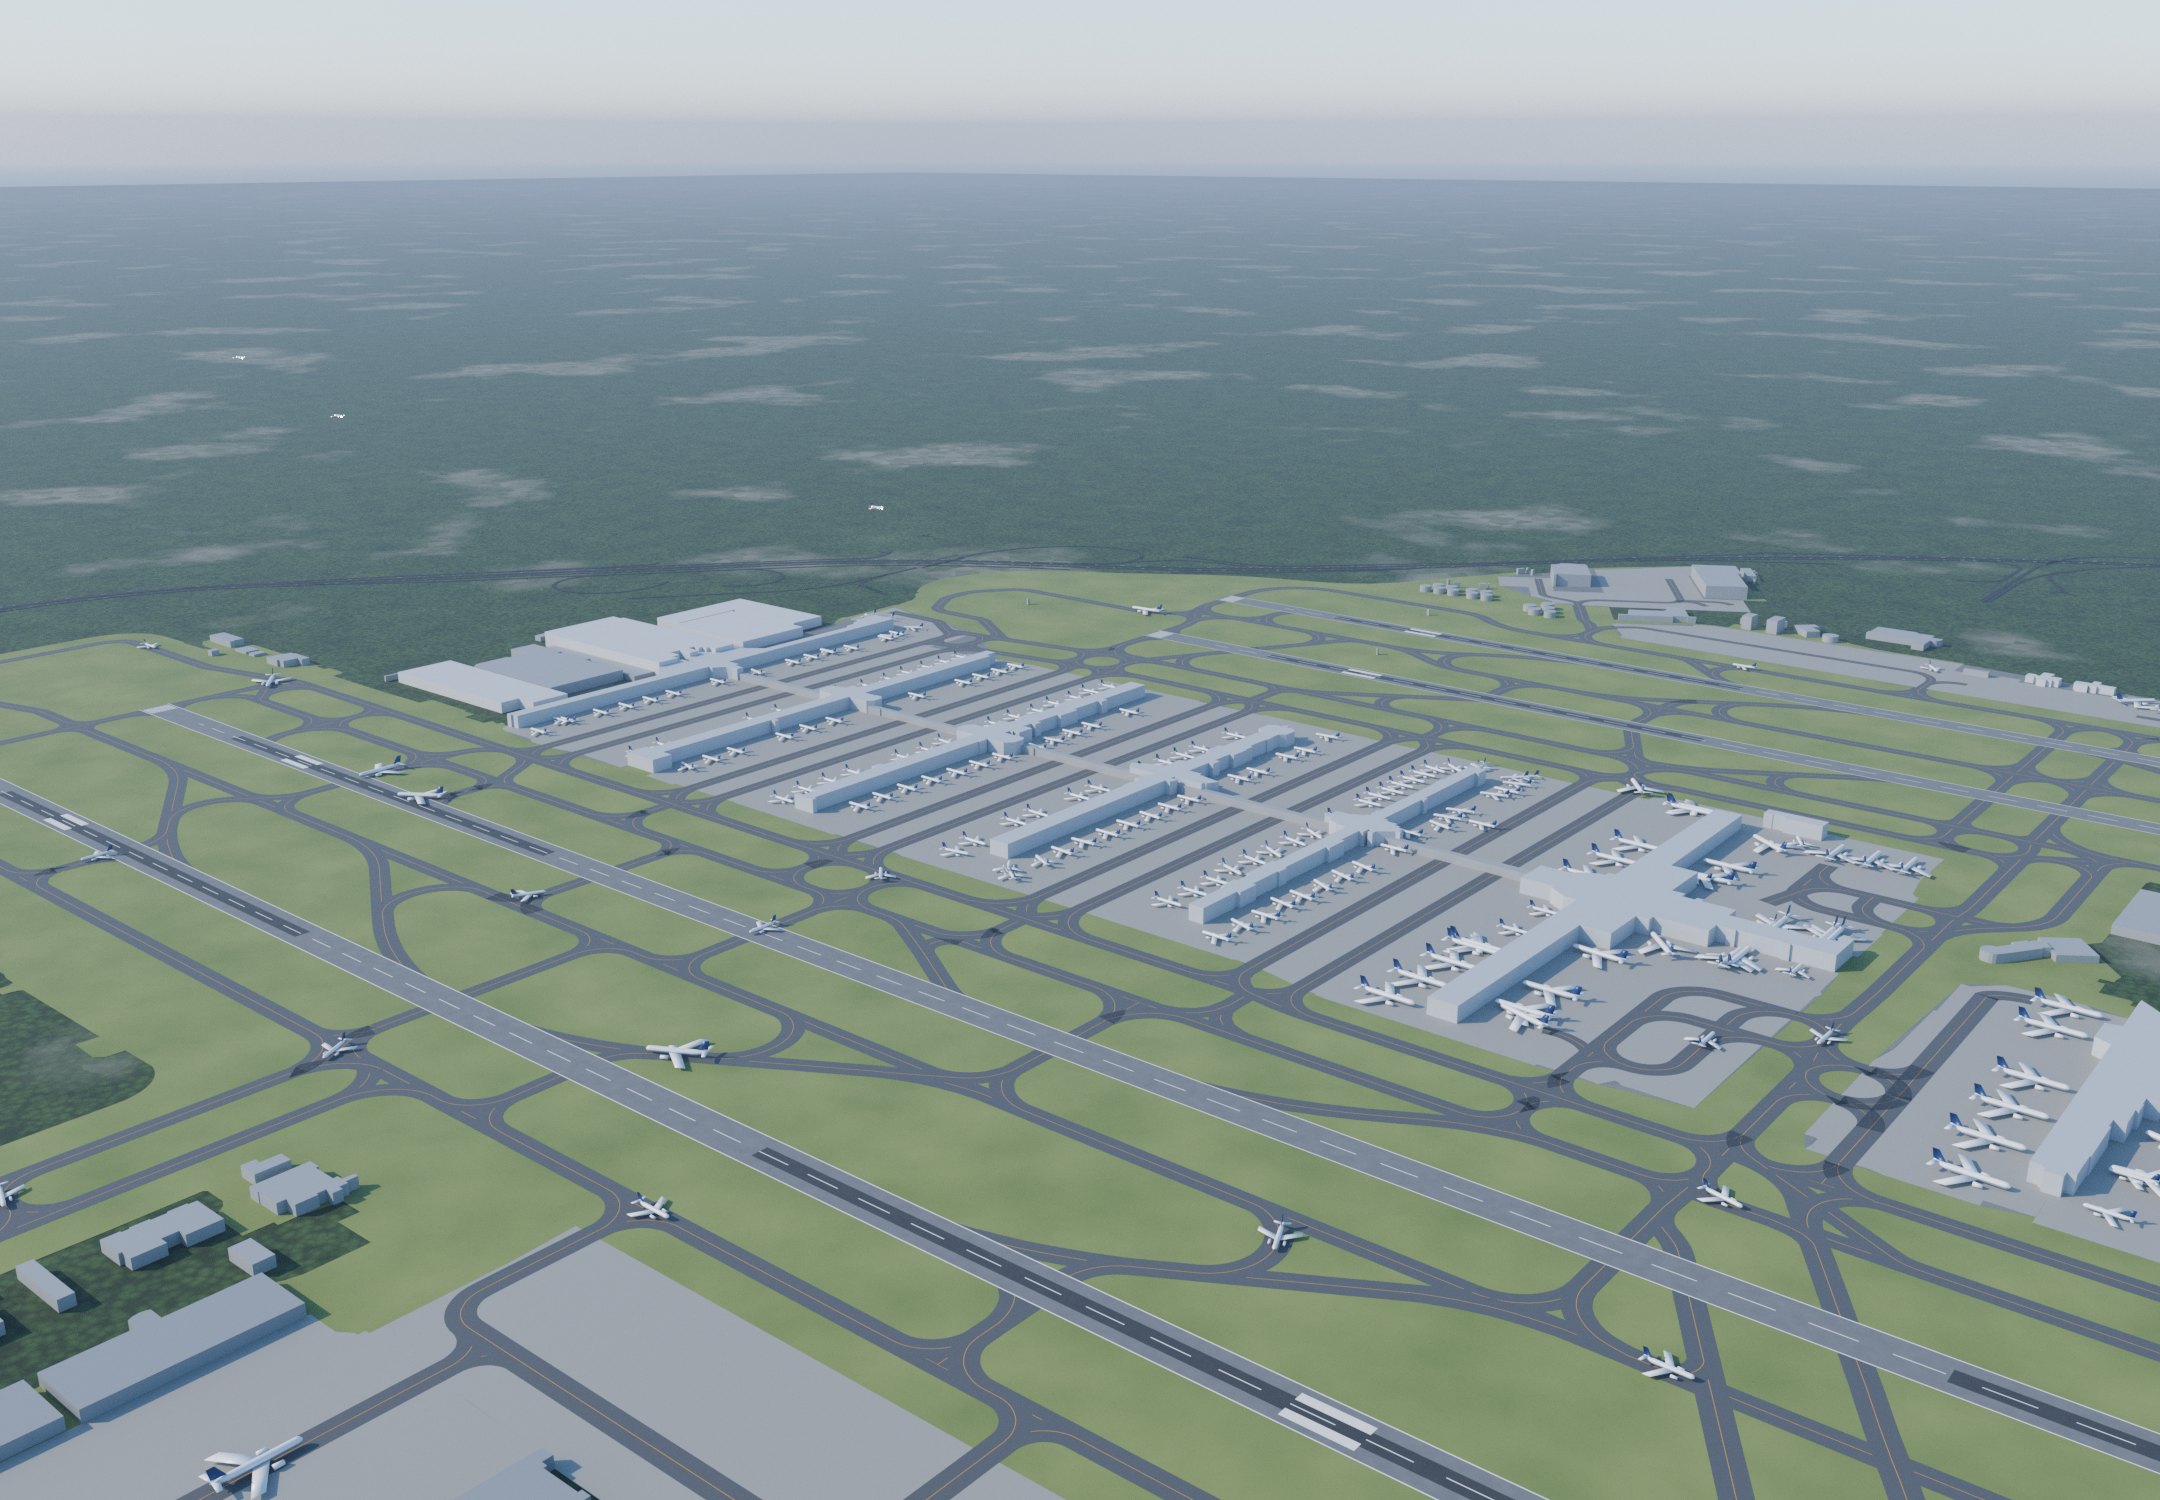
Rankings 2025
Departures board
Four ways to measure a busy airport: Atlanta leads on passengers, Dubai on international travellers, Hong Kong on cargo and Chicago O’Hare on flights.
Hubs and routes
The world’s busiest hubs
Each circle’s area matches the airport’s 2025 traffic; the arcs are the world’s busiest air routes. Drag to spin, pinch or use the buttons to zoom, and tap a hub for its figures.
Drag to spin · pinch, Ctrl + scroll or +/− to zoom
Busiest routes 2025 · seats
2019 → 2024 → 2025
The rank shuffle
Where each of 2025’s top 20 ranked before the pandemic, last year and now. Beijing Capital fell from second to 15th, while Istanbul climbed from 28th into the top 10.
Rebuilt in 3D
Runway fingerprints
Every top-20 airport rebuilt in 3D from OpenStreetMap: real runways, terminals and aircraft stands, all seen from the south with north up. Overlay them to compare footprints at one scale: Denver’s 4.9 km runway is the longest of the twenty.
3D models from OpenStreetMap data © OpenStreetMap contributors. Aircraft stand only at mapped parking positions; each model has its own scale bar.
Live, at 2025’s pace
Since you opened this page
Every dot is a traveller arriving or departing while you read, at 2025’s average rate.
Time on this page 0:00 ·
Gate ATL
Number one in 27 of 28 years
Atlanta has topped the passenger ranking every year since 1998 except 2020, when COVID-19 let Guangzhou Baiyun edge ahead.
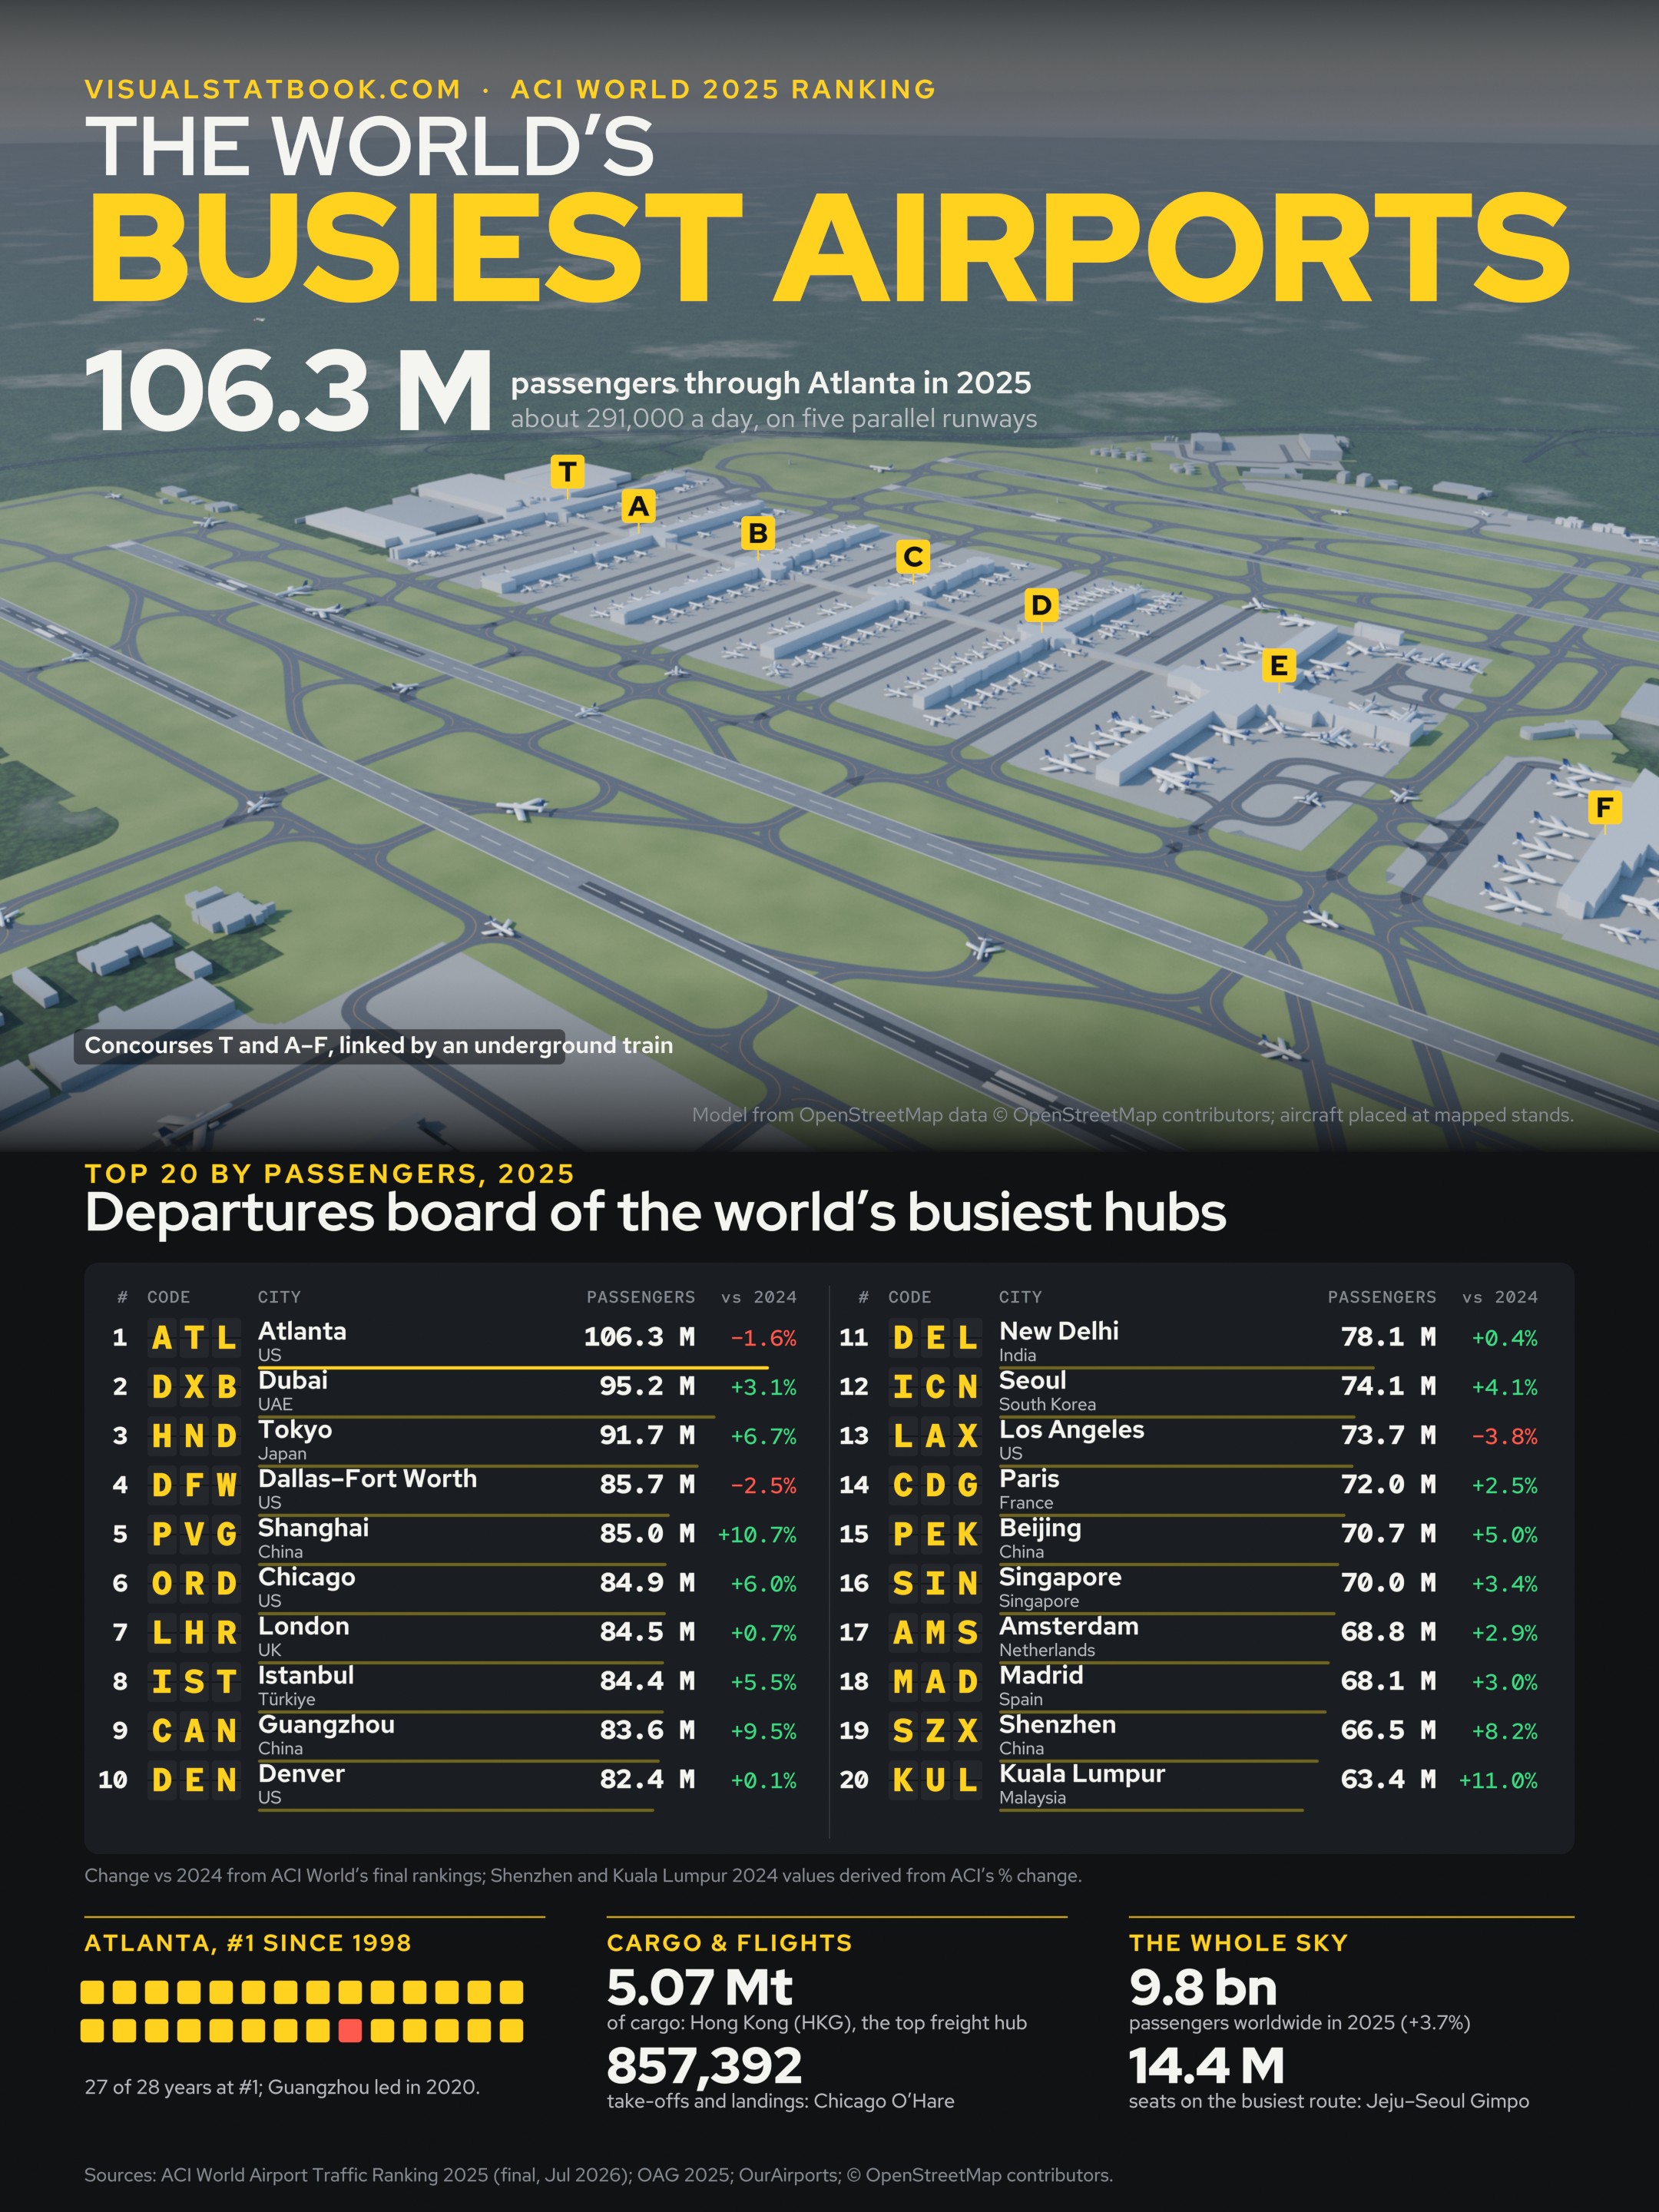
The poster
Every gate on one sheet
Atlanta in 3D, the top 20 departures board and the cargo and flight leaders on a 2160 × 2880 poster.
Open the full-size posterShow the full data table
| # | Airport | Code | City | Passengers 2025 | Passengers 2024 | Change | Rank 2019 | Runways | Longest runway |
|---|---|---|---|---|---|---|---|---|---|
| 1 | Hartsfield–Jackson Atlanta International Airport | ATL | Atlanta, US | 106,302,208 | 108,067,766 | −1.6% | 1 | 5 | 3,776 m |
| 2 | Dubai International Airport | DXB | Dubai, UAE | 95,192,160 | 92,331,506 | +3.1% | 4 | 2 | 4,447 m |
| 3 | Tokyo Haneda Airport | HND | Tokyo, Japan | 91,679,814 | 85,900,617 | +6.7% | 5 | 4 | 3,360 m |
| 4 | Dallas Fort Worth International Airport | DFW | Dallas–Fort Worth, US | 85,660,127 | 87,817,864 | −2.5% | 10 | 7 | 4,085 m |
| 5 | Shanghai Pudong International Airport | PVG | Shanghai, China | 84,994,548 | 76,787,039 | +10.7% | 8 | 5 | 4,000 m |
| 6 | Chicago O'Hare International Airport | ORD | Chicago, US | 84,856,018 | 80,043,050 | +6.0% | 6 | 8 | 3,962 m |
| 7 | London Heathrow Airport | LHR | London, UK | 84,482,126 | 83,884,572 | +0.7% | 7 | 2 | 3,901 m |
| 8 | Istanbul Airport | IST | Istanbul, Türkiye | 84,437,710 | 80,073,252 | +5.5% | 28 | 6 | 4,100 m |
| 9 | Guangzhou Baiyun International Airport | CAN | Guangzhou, China | 83,582,952 | 76,365,092 | +9.5% | 11 | 5 | 3,800 m |
| 10 | Denver International Airport | DEN | Denver, US | 82,427,962 | 82,358,744 | +0.1% | 16 | 6 | 4,877 m |
| 11 | Indira Gandhi International Airport | DEL | New Delhi, India | 78,148,081 | 77,820,834 | +0.4% | 17 | 4 | 4,430 m |
| 12 | Incheon International Airport | ICN | Seoul, South Korea | 74,126,912 | 71,212,515 | +4.1% | 14 | 4 | 4,000 m |
| 13 | Los Angeles International Airport | LAX | Los Angeles, US | 73,709,594 | 76,588,028 | −3.8% | 3 | 4 | 3,930 m |
| 14 | Paris Charles de Gaulle Airport | CDG | Paris, France | 72,029,407 | 70,290,260 | +2.5% | 9 | 4 | 4,215 m |
| 15 | Beijing Capital International Airport | PEK | Beijing, China | 70,742,712 | 67,367,428 | +5.0% | 2 | 3 | 3,800 m |
| 16 | Singapore Changi Airport | SIN | Singapore, Singapore | 69,982,000 | 67,650,000 | +3.4% | 18 | 2 | 4,000 m |
| 17 | Amsterdam Airport Schiphol | AMS | Amsterdam, Netherlands | 68,771,592 | 66,828,759 | +2.9% | 12 | 6 | 3,800 m |
| 18 | Adolfo Suárez Madrid–Barajas Airport | MAD | Madrid, Spain | 68,118,754 | 66,148,340 | +3.0% | 22 | 4 | 4,350 m |
| 19 | Shenzhen Bao'an International Airport | SZX | Shenzhen, China | 66,485,213 | 61,446,592* | +8.2% | 26 | 3 | 3,800 m |
| 20 | Kuala Lumpur International Airport | KUL | Kuala Lumpur, Malaysia | 63,409,501 | 57,125,677* | +11.0% | 21 | 3 | 4,124 m |
* Shenzhen and Kuala Lumpur were outside ACI’s 2024 top 20, so their 2024 values are derived from ACI’s 2025 percentage changes. Singapore’s change is computed from its published 2024 figure; ACI’s 2025 table gives +3.5%, probably against a revised 2024 value. ACI published only a top 20 for 2025. Runways are open runways in OurAirports, excluding helipads and water runways.
Information
Busiest airports FAQ
What is the busiest airport in the world?
Hartsfield–Jackson Atlanta International Airport, with 106,302,208 passengers in 2025 (−1.6% on 2024), ahead of Dubai (95.2 million) and Tokyo Haneda (91.7 million), according to ACI World’s final 2025 ranking.
How long has Atlanta been the world’s busiest airport?
By the airport’s count, every year since 1998 except 2020: 27 of the 28 years to 2025. In 2020, during COVID-19, Guangzhou Baiyun handled 43.8 million passengers to Atlanta’s 42.9 million. One ACI release dates Atlanta’s lead from 2000 rather than 1998.
Which airport has the most international passengers?
Dubai International, with 95.2 million international passengers in 2025, all of its traffic. London Heathrow (79.9 million) and Seoul Incheon (73.6 million) follow. These are ACI’s preliminary figures from April 2026.
Which airport handles the most air cargo?
Hong Kong, with 5.07 million tonnes of freight and mail in 2025, followed by Shanghai Pudong (4.09 million) and Anchorage (3.85 million, including transit freight).
Which airport has the most flights?
Chicago O’Hare, with 857,392 take-offs and landings in 2025 (+10.5%). It overtook Atlanta (807,625), which had led the aircraft-movements ranking since 2020.
How many passengers used the world’s airports in 2025?
About 9.8 billion, +3.7% on 2024 and +6.5% above 2019. The top 20 airports handled 1.59 billion of them, about 16%.